

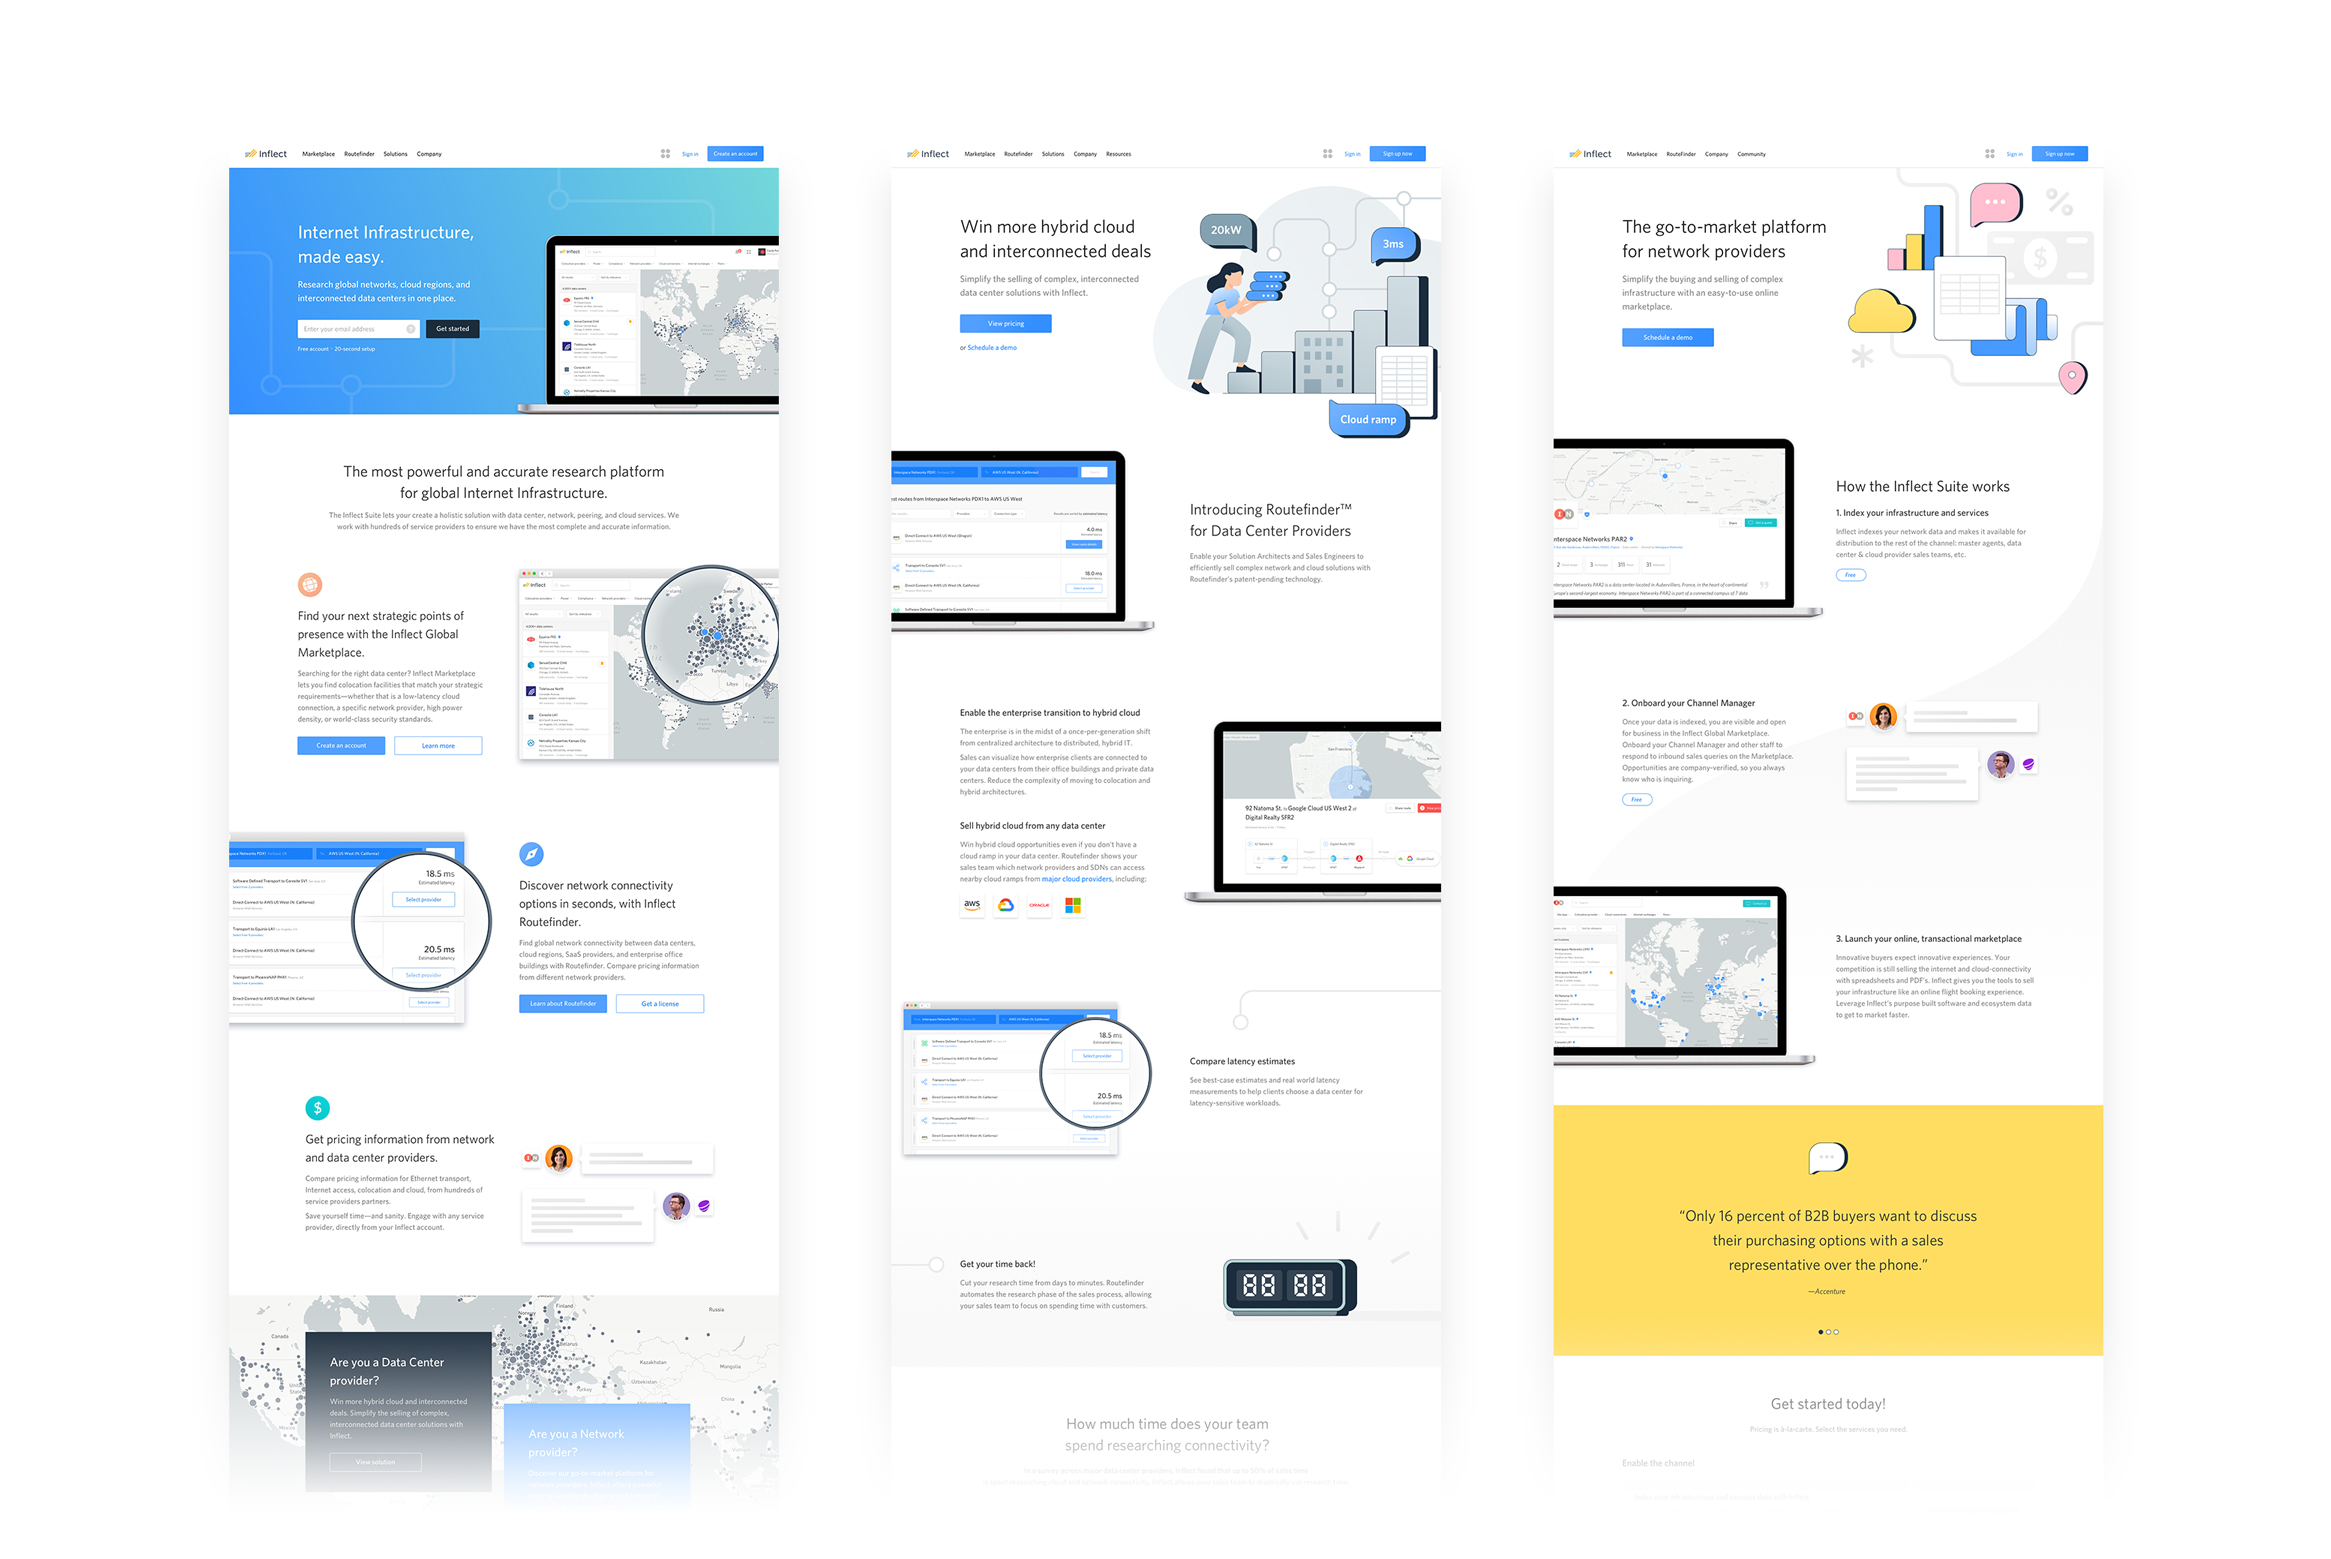
A modern marketplace for the internet infrastructure industry
As the first Product & Design hire, I designed, built, and validated a marketplace for a $100+ Billion industry from the ground up, growing the team along the way. We raised millions in seed funding from Silicon Valley veterans and worked our way toward product market fit.
The internet infrastructure industry is niche, technical, and severely lacking in user-centered modern product design. My team built and iterated on the product interaction model, visual system, user flows, user research and feedback processes, as well as our marketing site and product marketing content.
Director of Experience Design, November 2016–December 2018
Objective
Build a significantly better way for network engineers to research and purchase internet infrastructure, capitalizing on a global industry worth hundreds of billions of dollars.
Currently, everything is done almost entirely through sales people. Prior to Inflect, there wasn’t a single neutral tool to help buyers answer two important questions:
Which providers offer the solutions I need in the places I need them?
How do I purchase the solutions and what do they cost?
Approach
Understand the needs of data center buyers through regular product feedback and testing sessions.
To validate our hypothesis that buyers would prefer a single neutral platform to connect with service providers, my team and I focused on providing people with better information than they could get anywhere else, get it to them faster than anywhere else, and making it as easy as possible for them to request pricing from service providers without playing phone tag.
Understand how data center and network providers position themselves and communicate their value to potential buyers.
We built deep relationships with our service provider partners, and in turn they were more likely to share more complete data with us and dedicate time to inbound leads we sent their way. We set up interview sessions to understand how each positions themselves to stand out from their competitors and brainstormed ways to showcase their unique value propositions to potential buyers on Inflect.
Solutions
We created a suite of products aimed at helping both buyers and sellers of infrastructure.
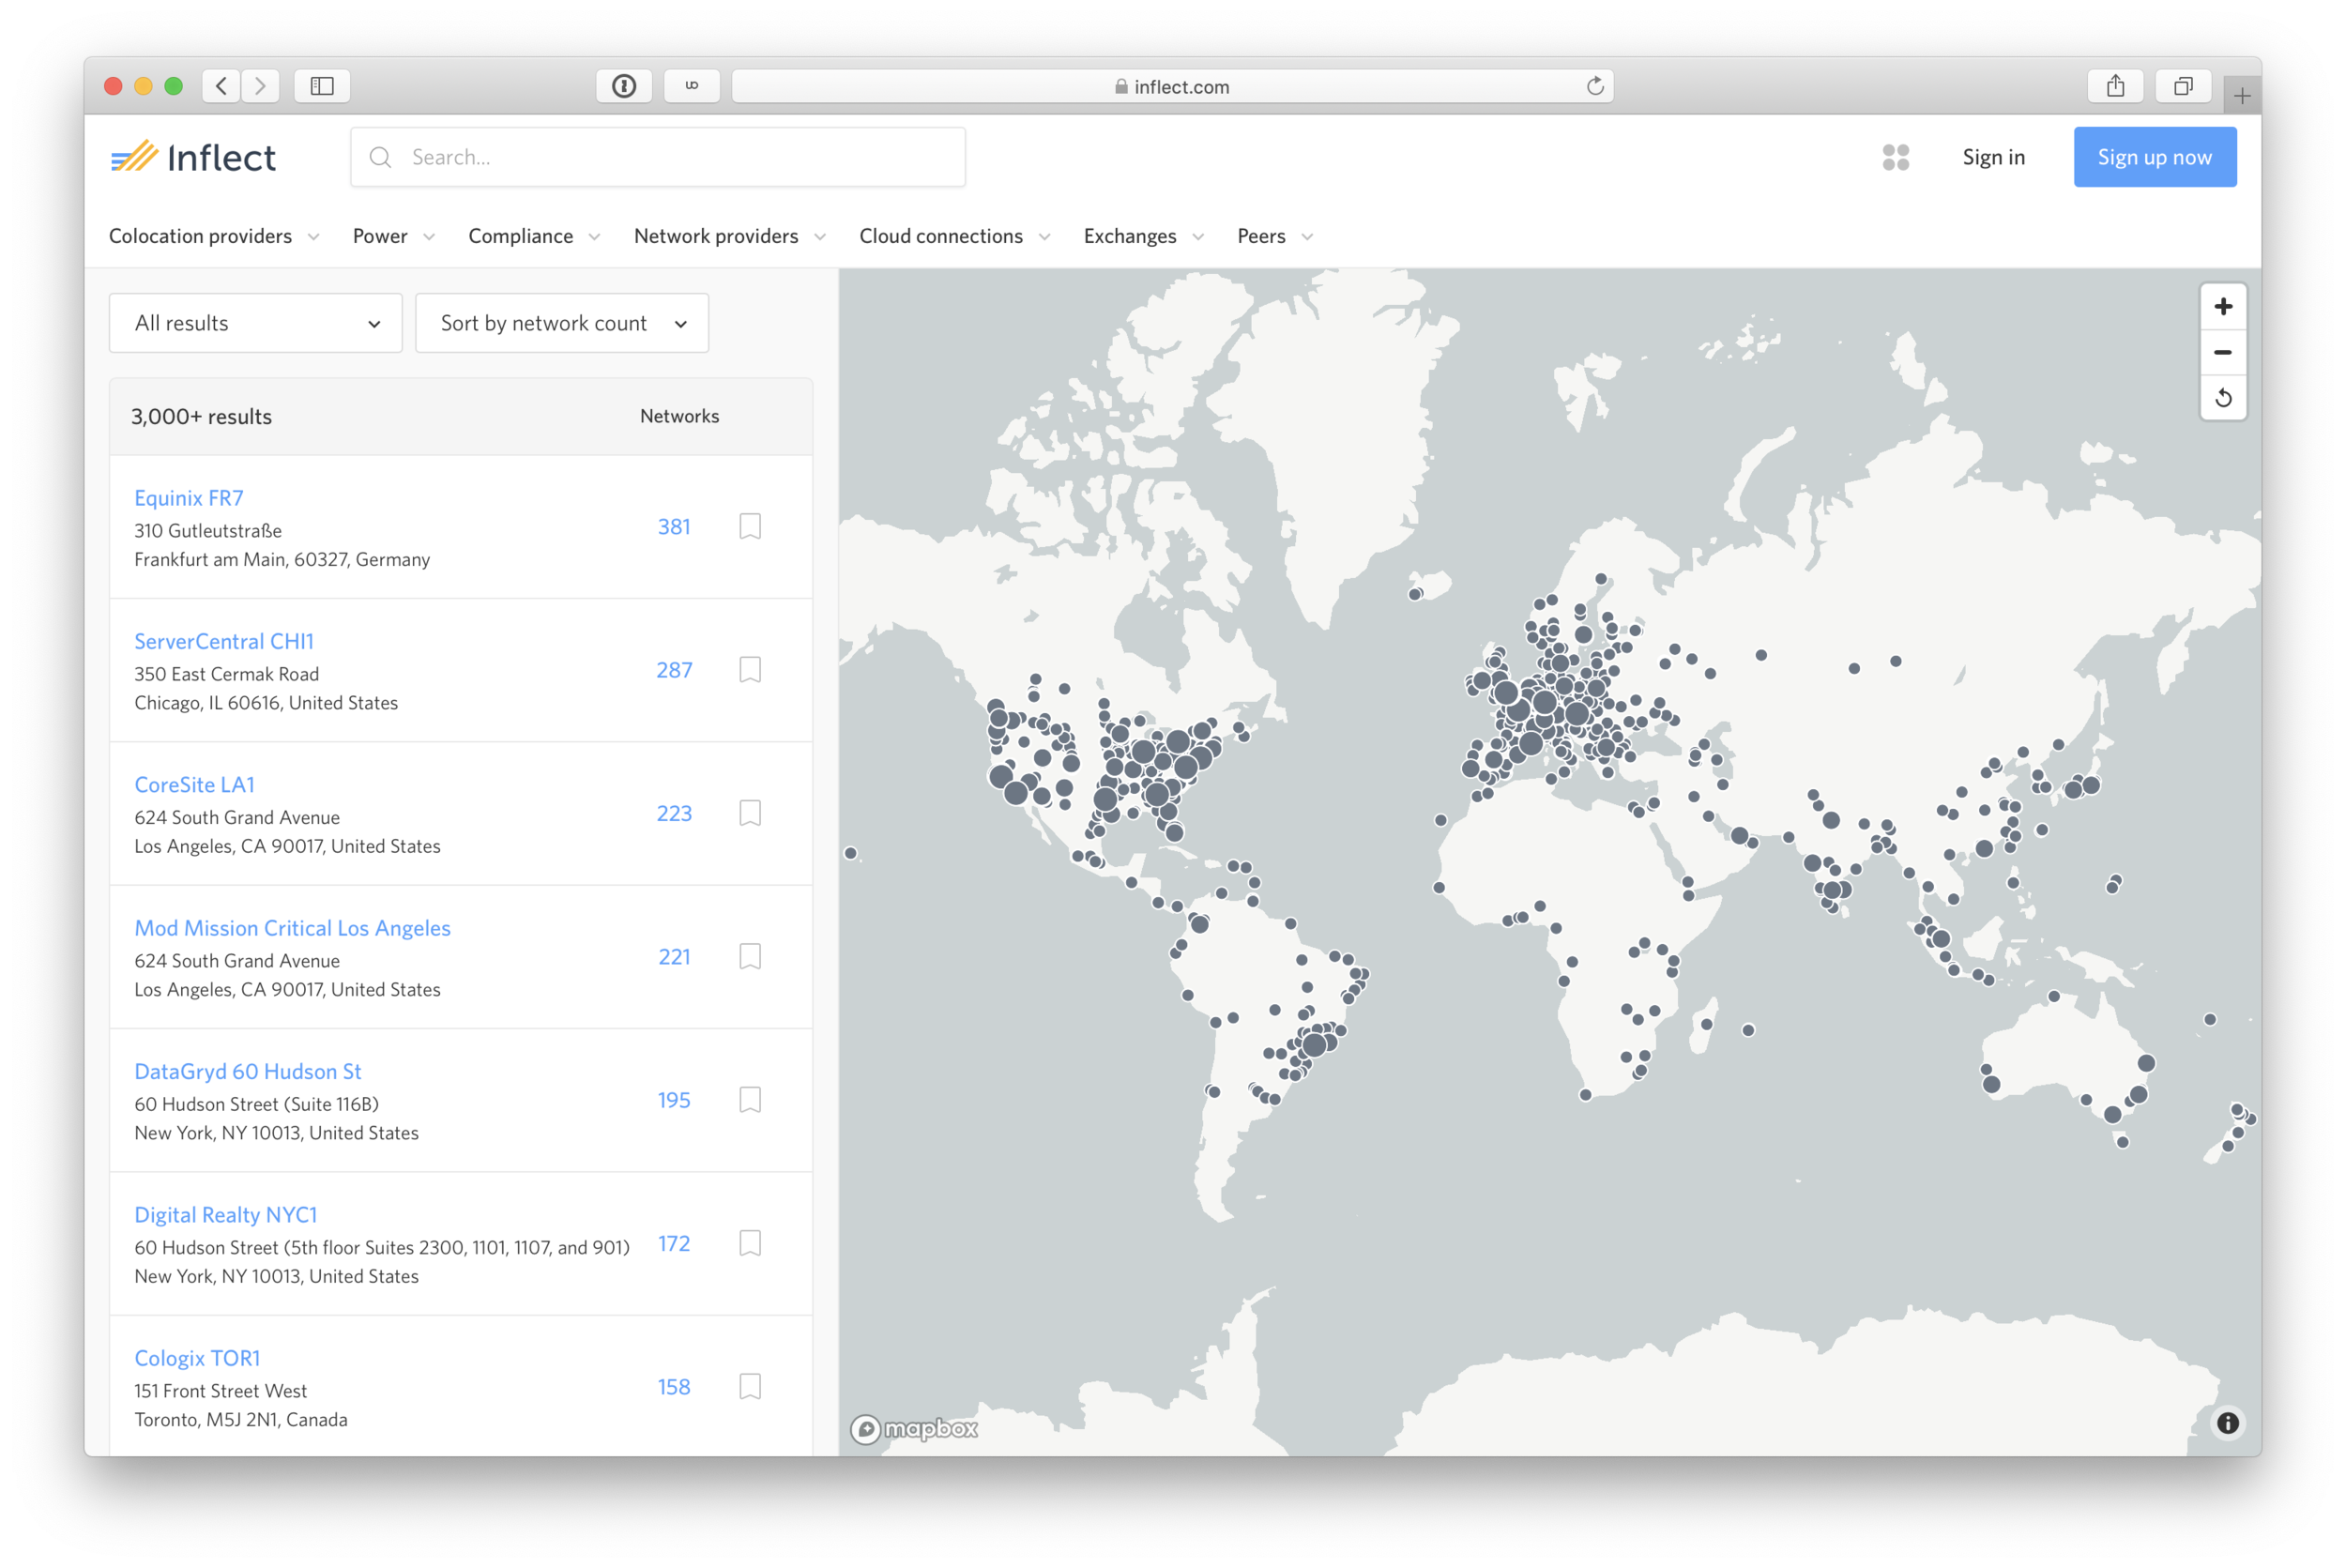
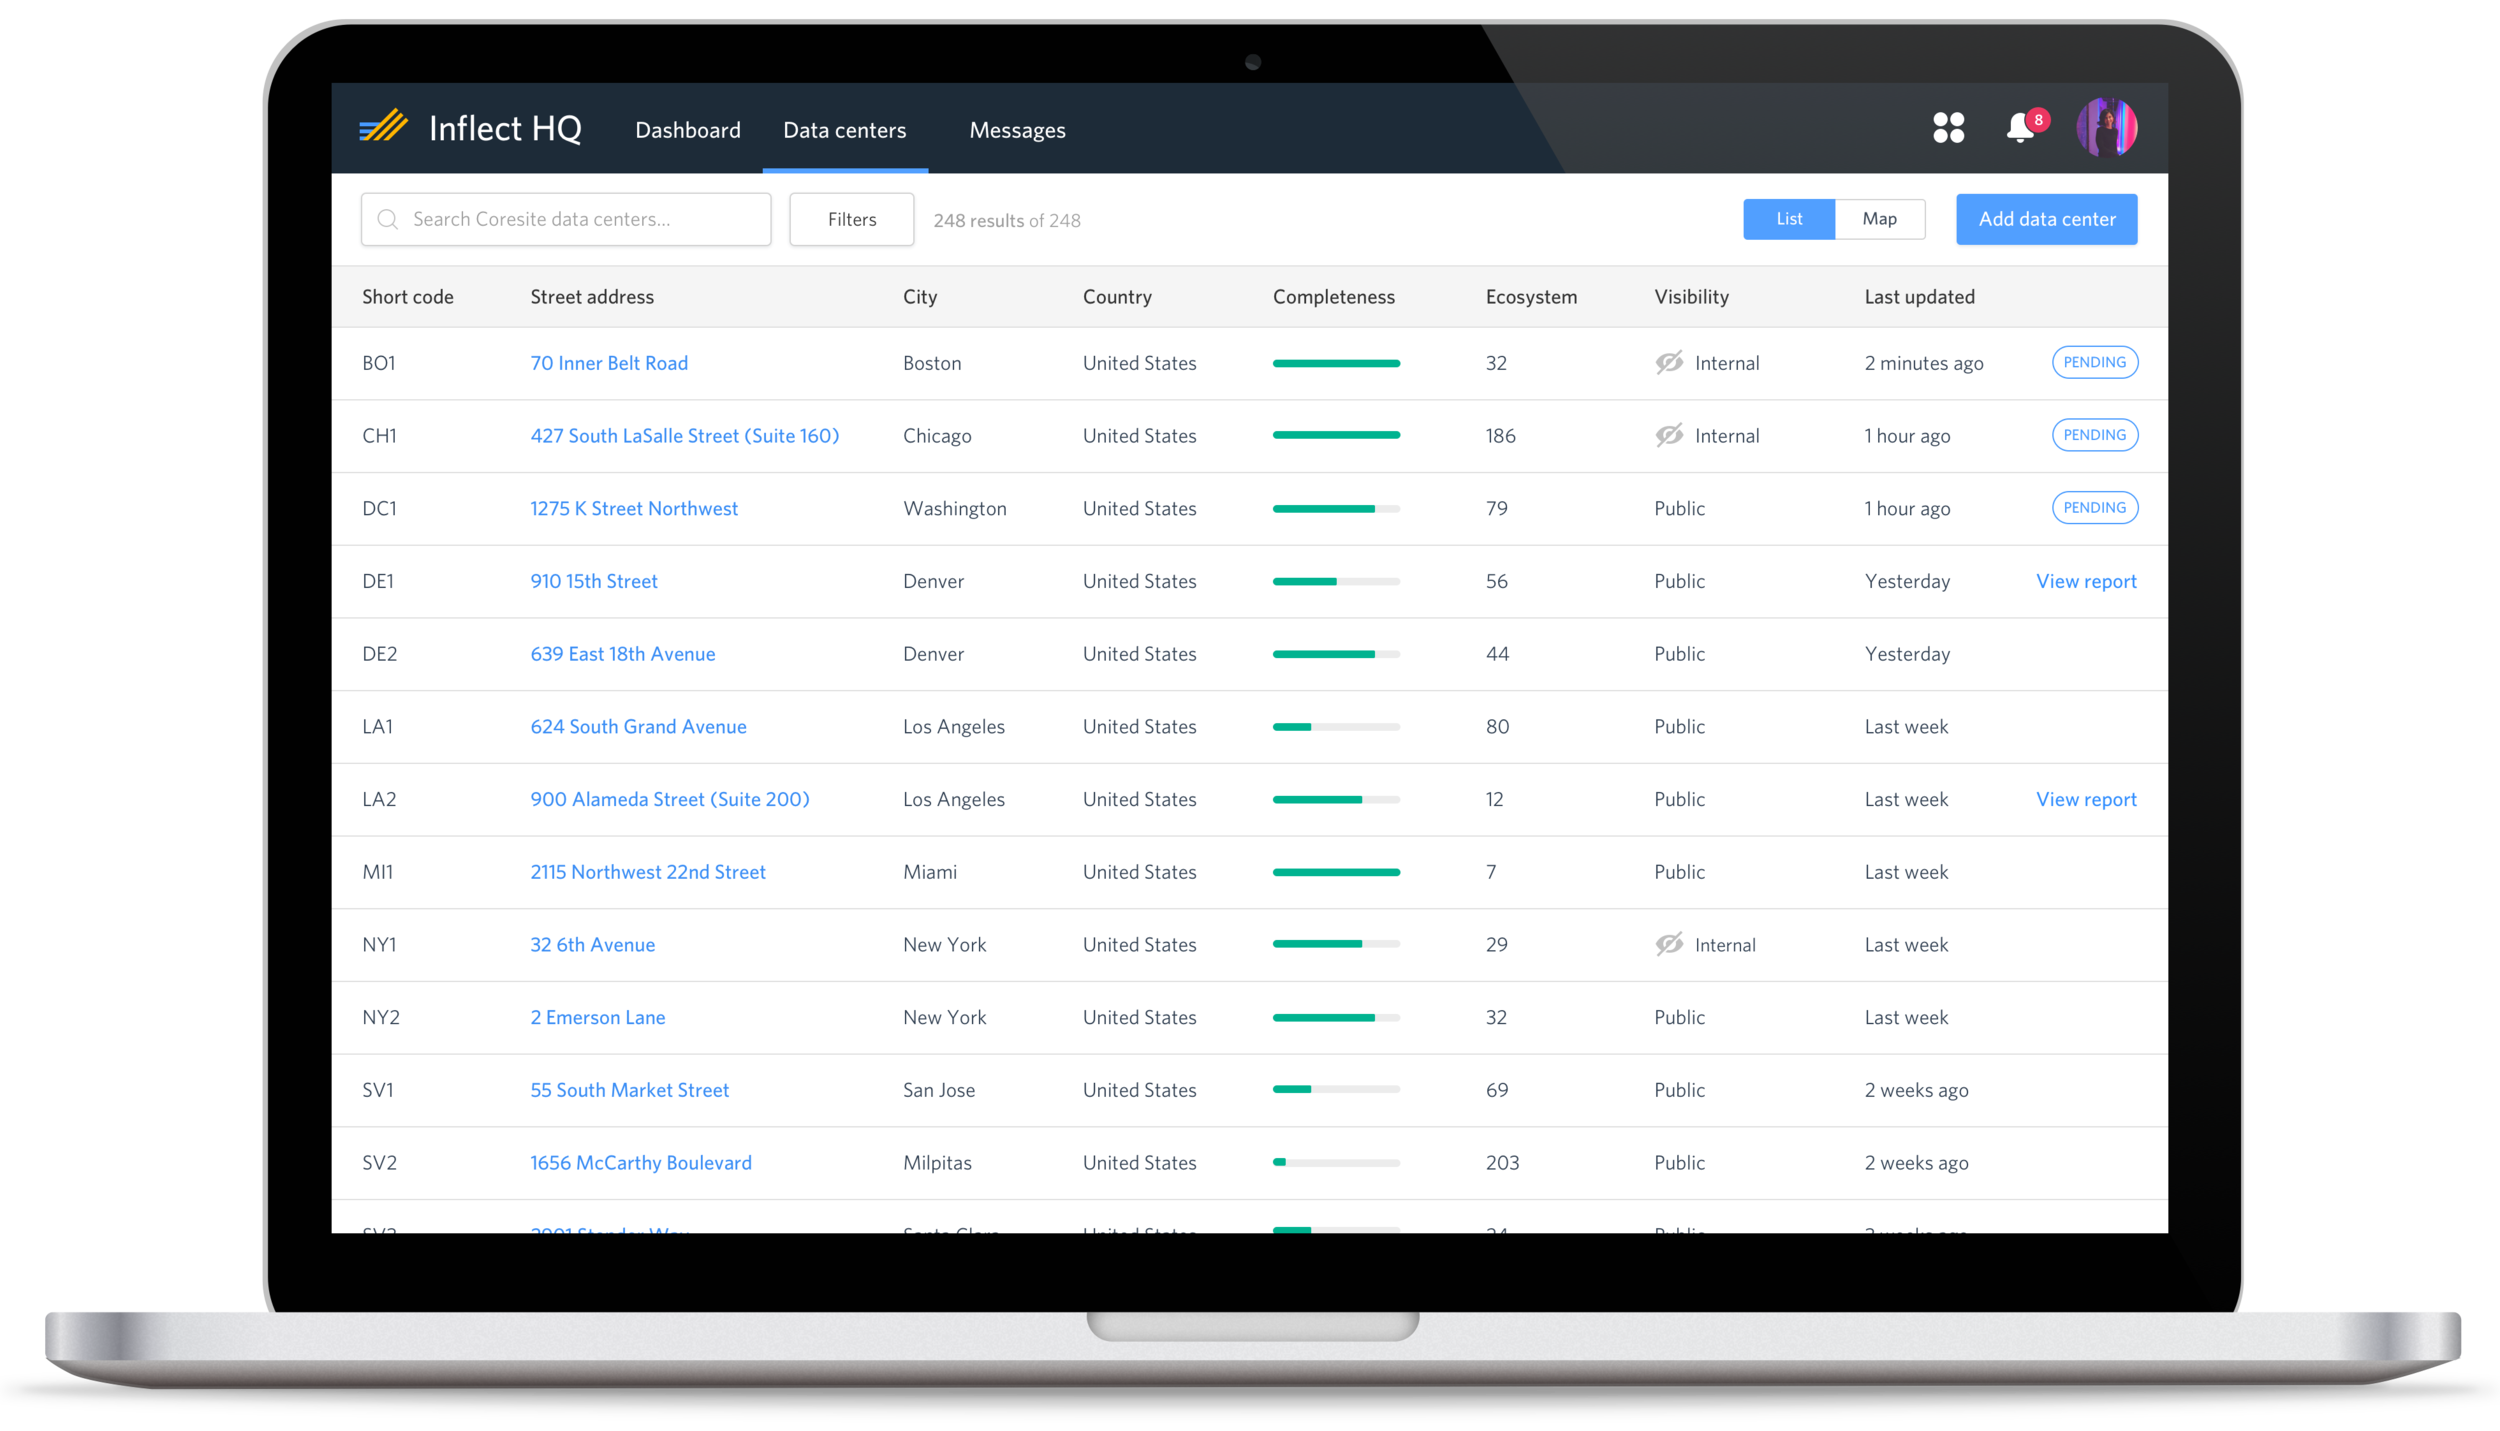
Data Center Marketplace
Inflect’s Data Center Marketplace is the most accurate source of information on data centers around the world and the service provider ecosystems within them.

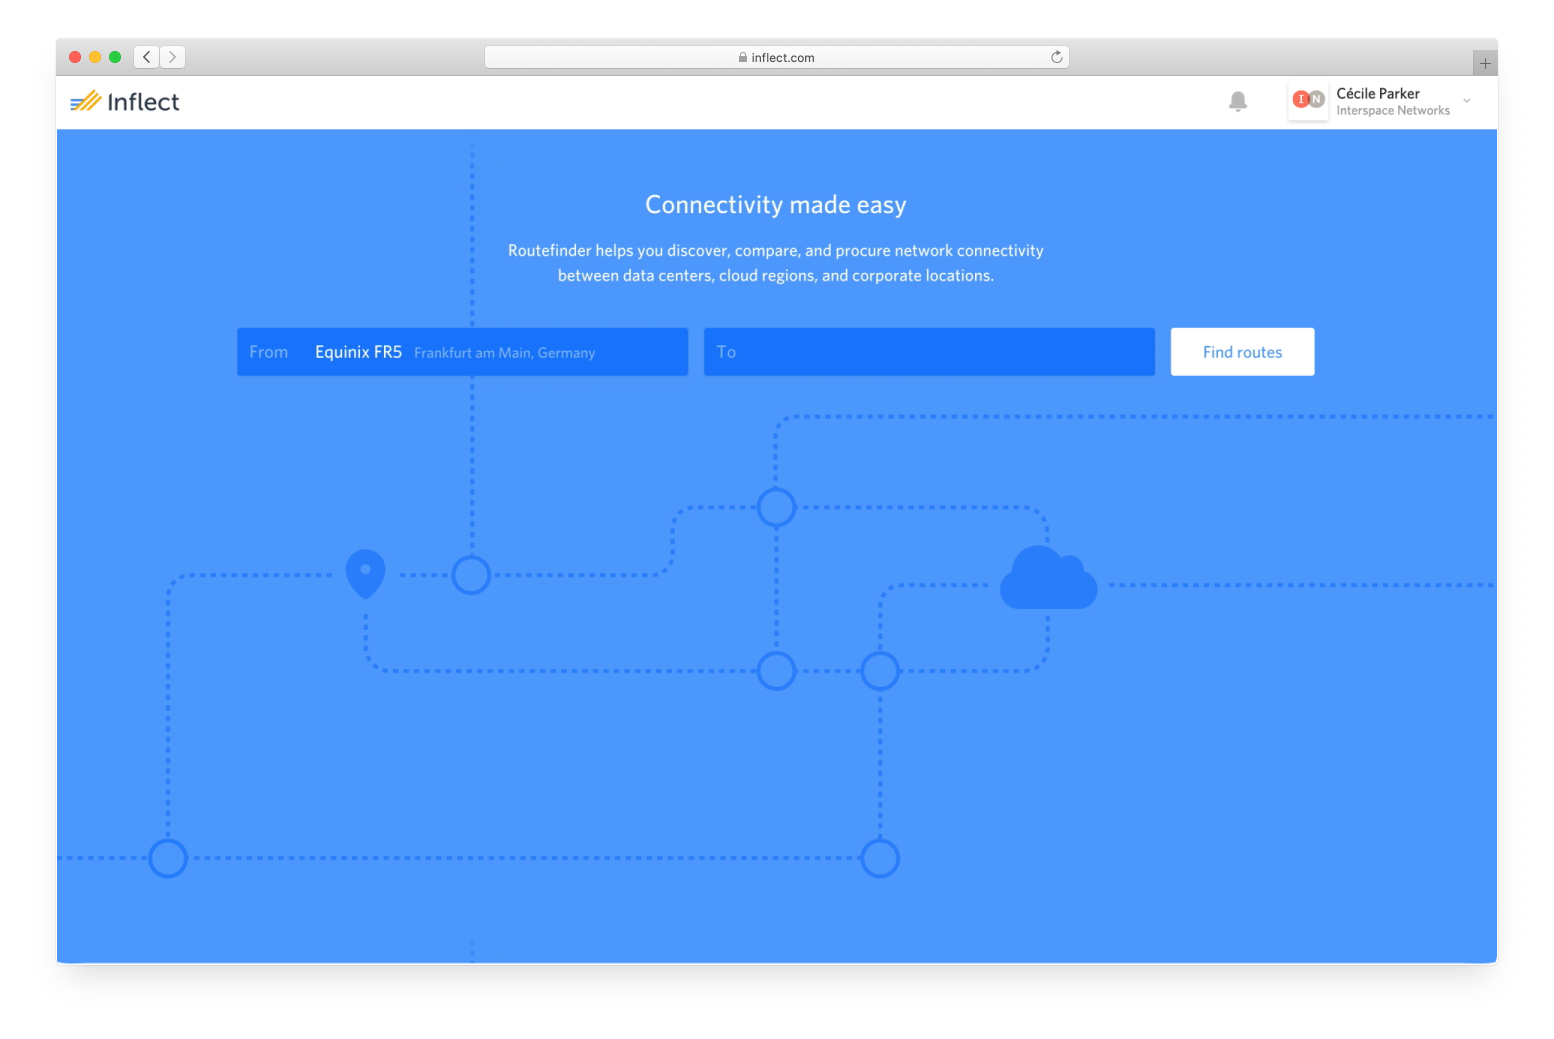
Network Connectivity Search
Our network connectivity search tool, “Routefinder” is built on top of the data center marketplace. Enter two locations and Routefinder presents all of the network providers who can service between those locations.

Asset management
Inflect Asset Manager gave service providers greater visibility into their own infrastructure and product offerings around the world, creating an up-to-date, single source of truth across provider operations, marketing, and sales orgs.

Data Center Marketplace Overview
Finding the right data center is a long, manual process for buyers.
Our vision was to improve the buyer experience starting with the way they research and expanding into other parts of the customer journey to ultimately become the default resource for internet infrastructure procurement and management.
Our first goal: reduce the research process timeline from weeks to minutes.

I uncovered common pain points through interviews with both buyers and sellers of network infrastructure.
The network engineers and provider salespeople I spoke with shared many frustrations:
Different websites for each provider, no single place to see all options.
Jargon, buzzwords, different marketing names for the same products.
Out-of-date data is the norm everywhere.
Phone calls are to salespeople, not networking experts. Provider salespeople sell what they have, not necessarily what’s right for buyers’ use case.
Incredibly long process, many phone calls required to make any progress.

A map of the 12+ conversations that need to happen to determine if two selected network providers offer services within a particular data center.
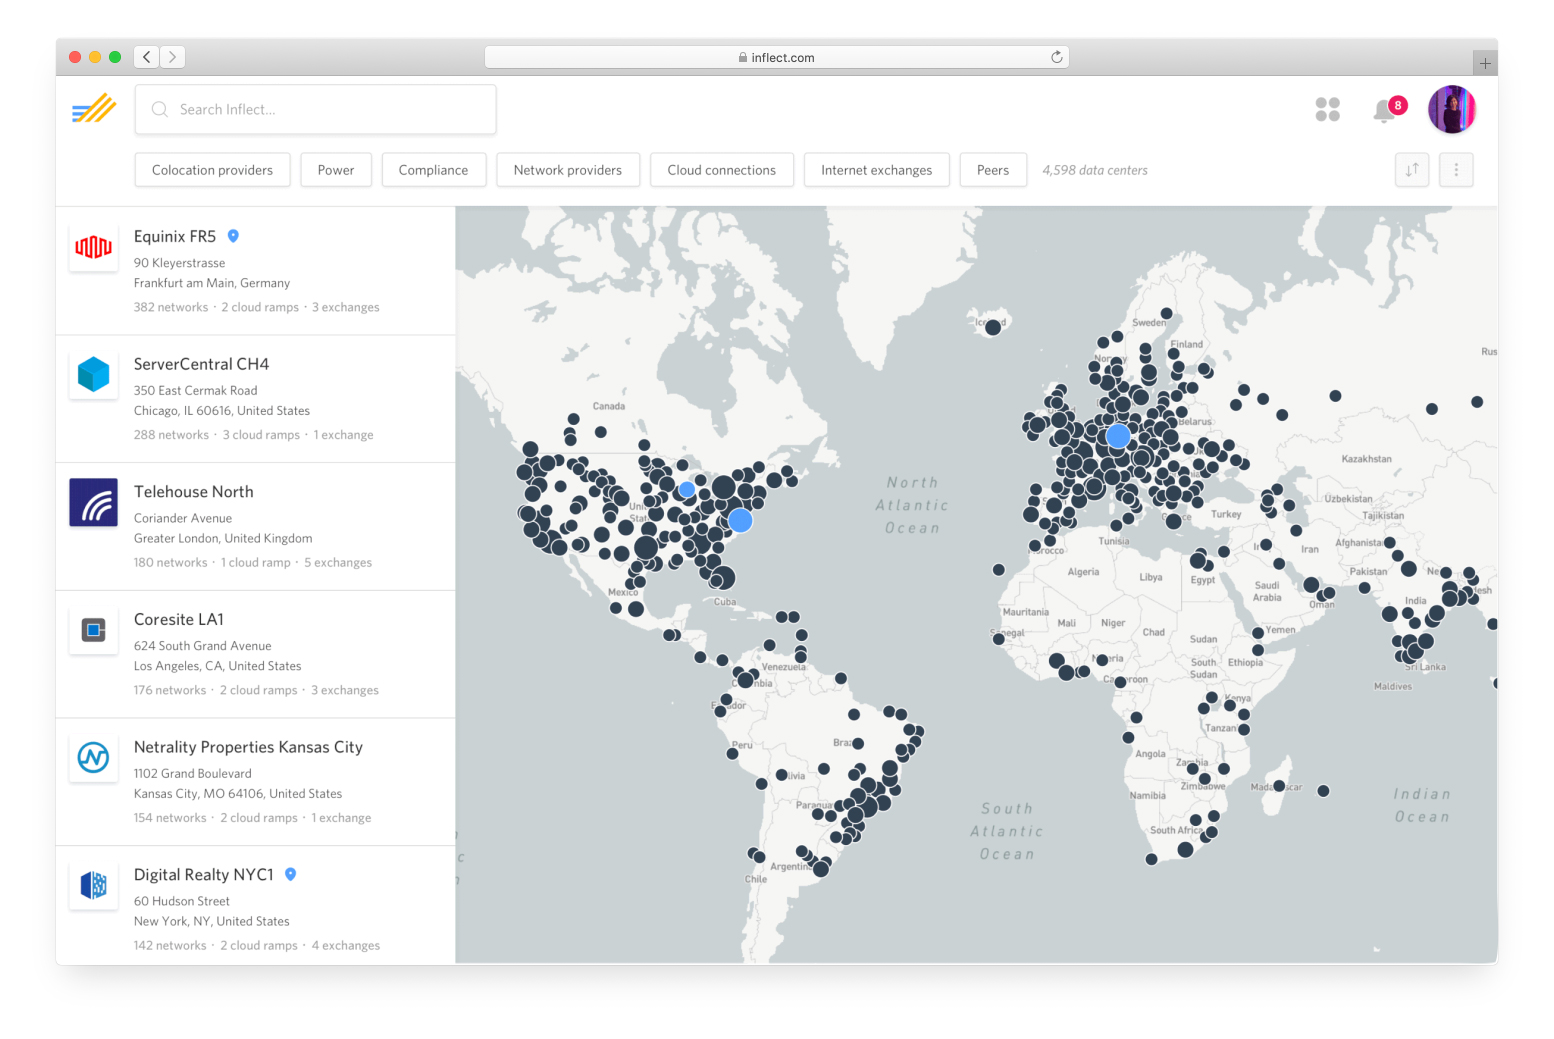
Our search experience helps buyers find the right data centers for their needs.
What matters to buyers when making data center purchasing decisions? We built a search experience flexible enough for the most common use cases.
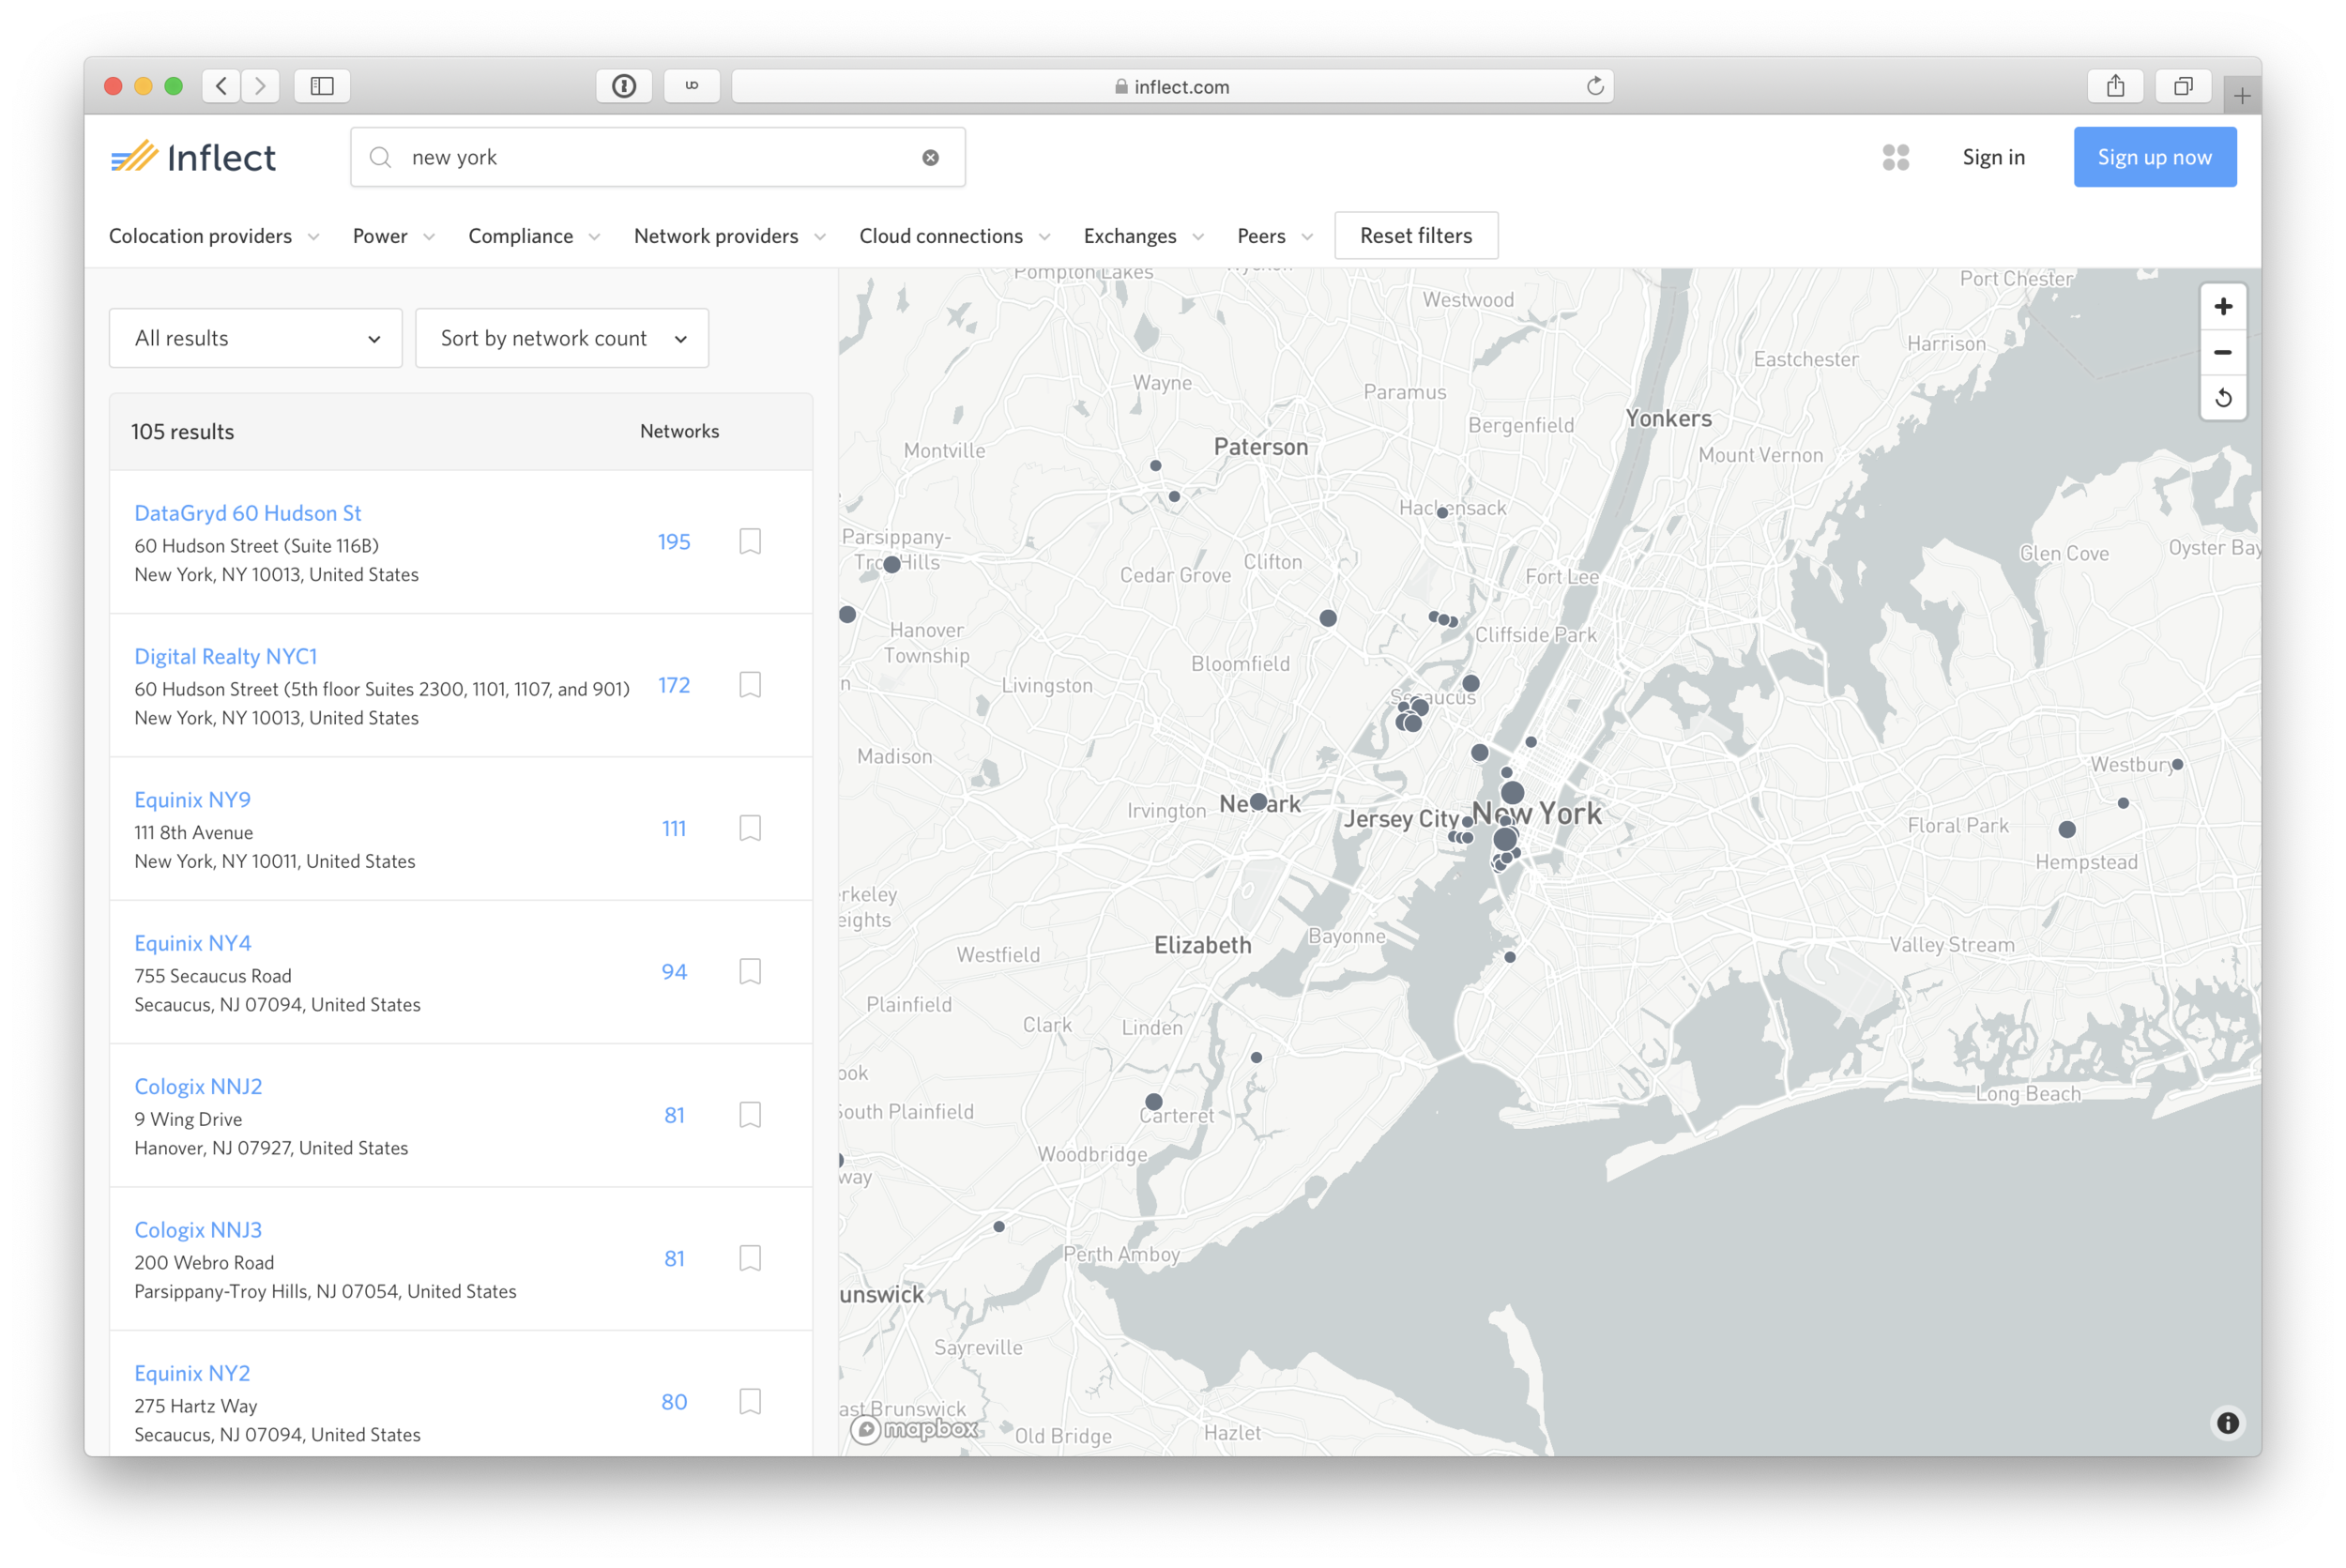
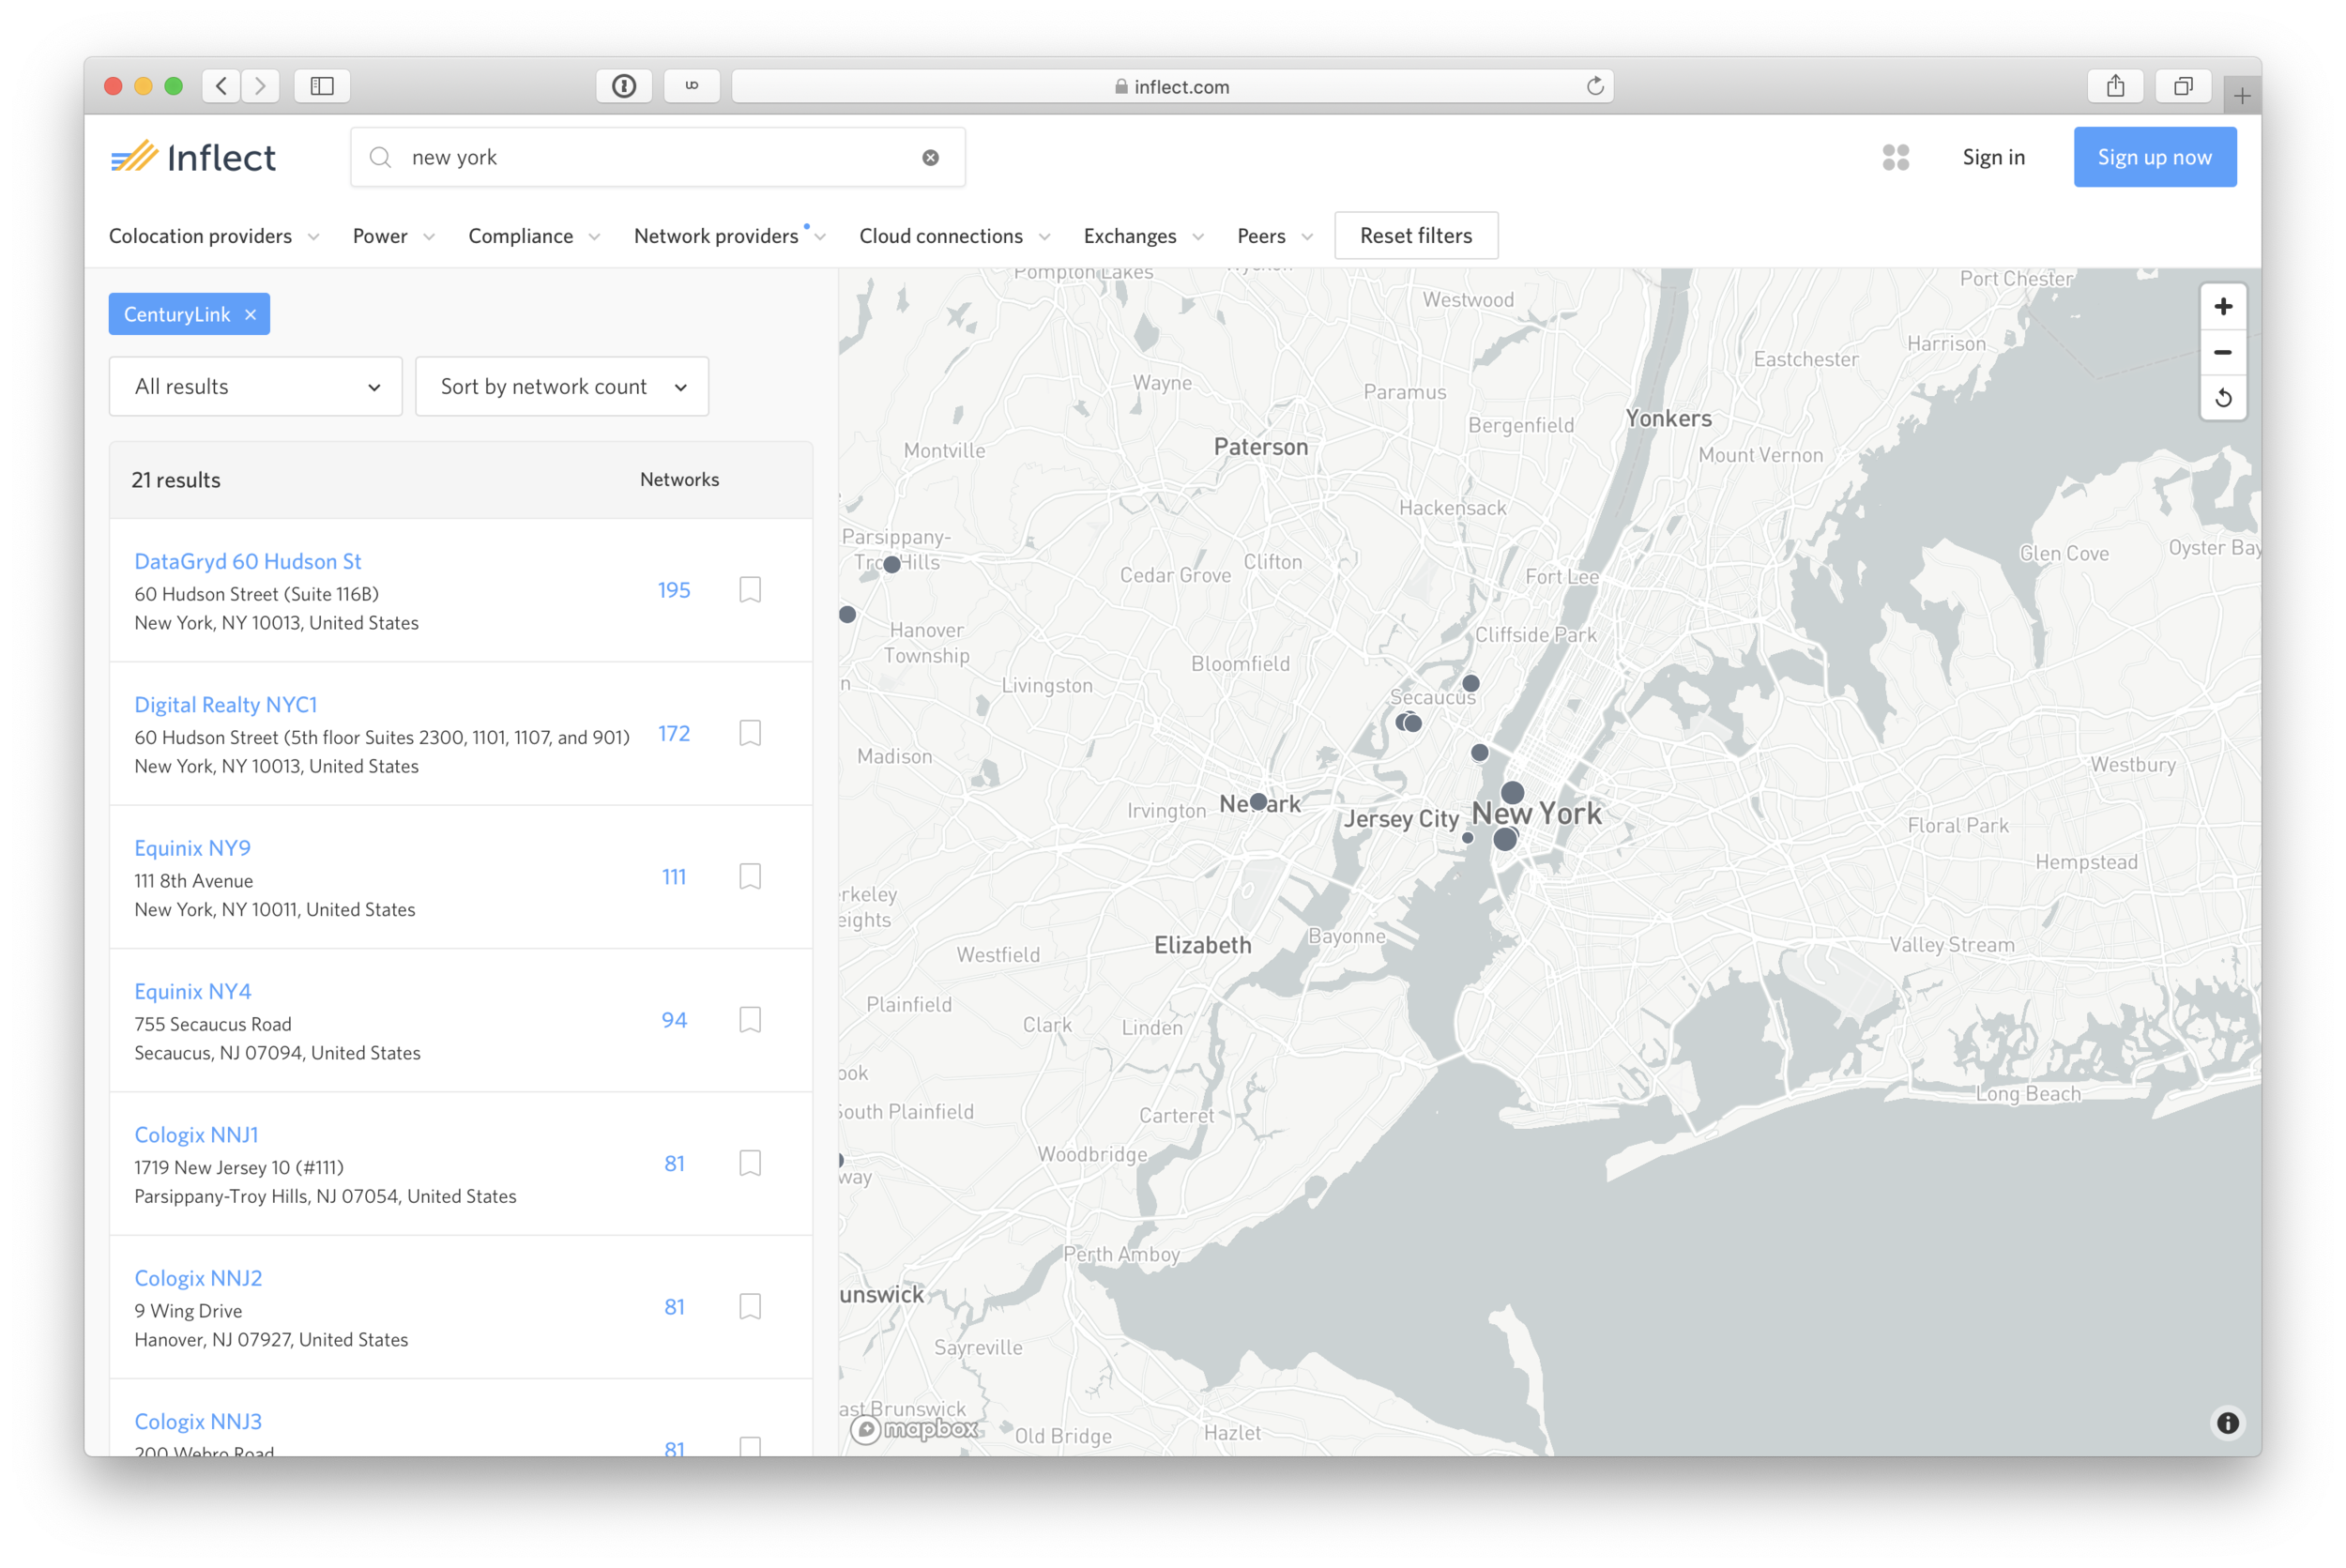
Use case 1
Buyer wants to stick with a provider his/her company already has a relationship with to keep billing simple.
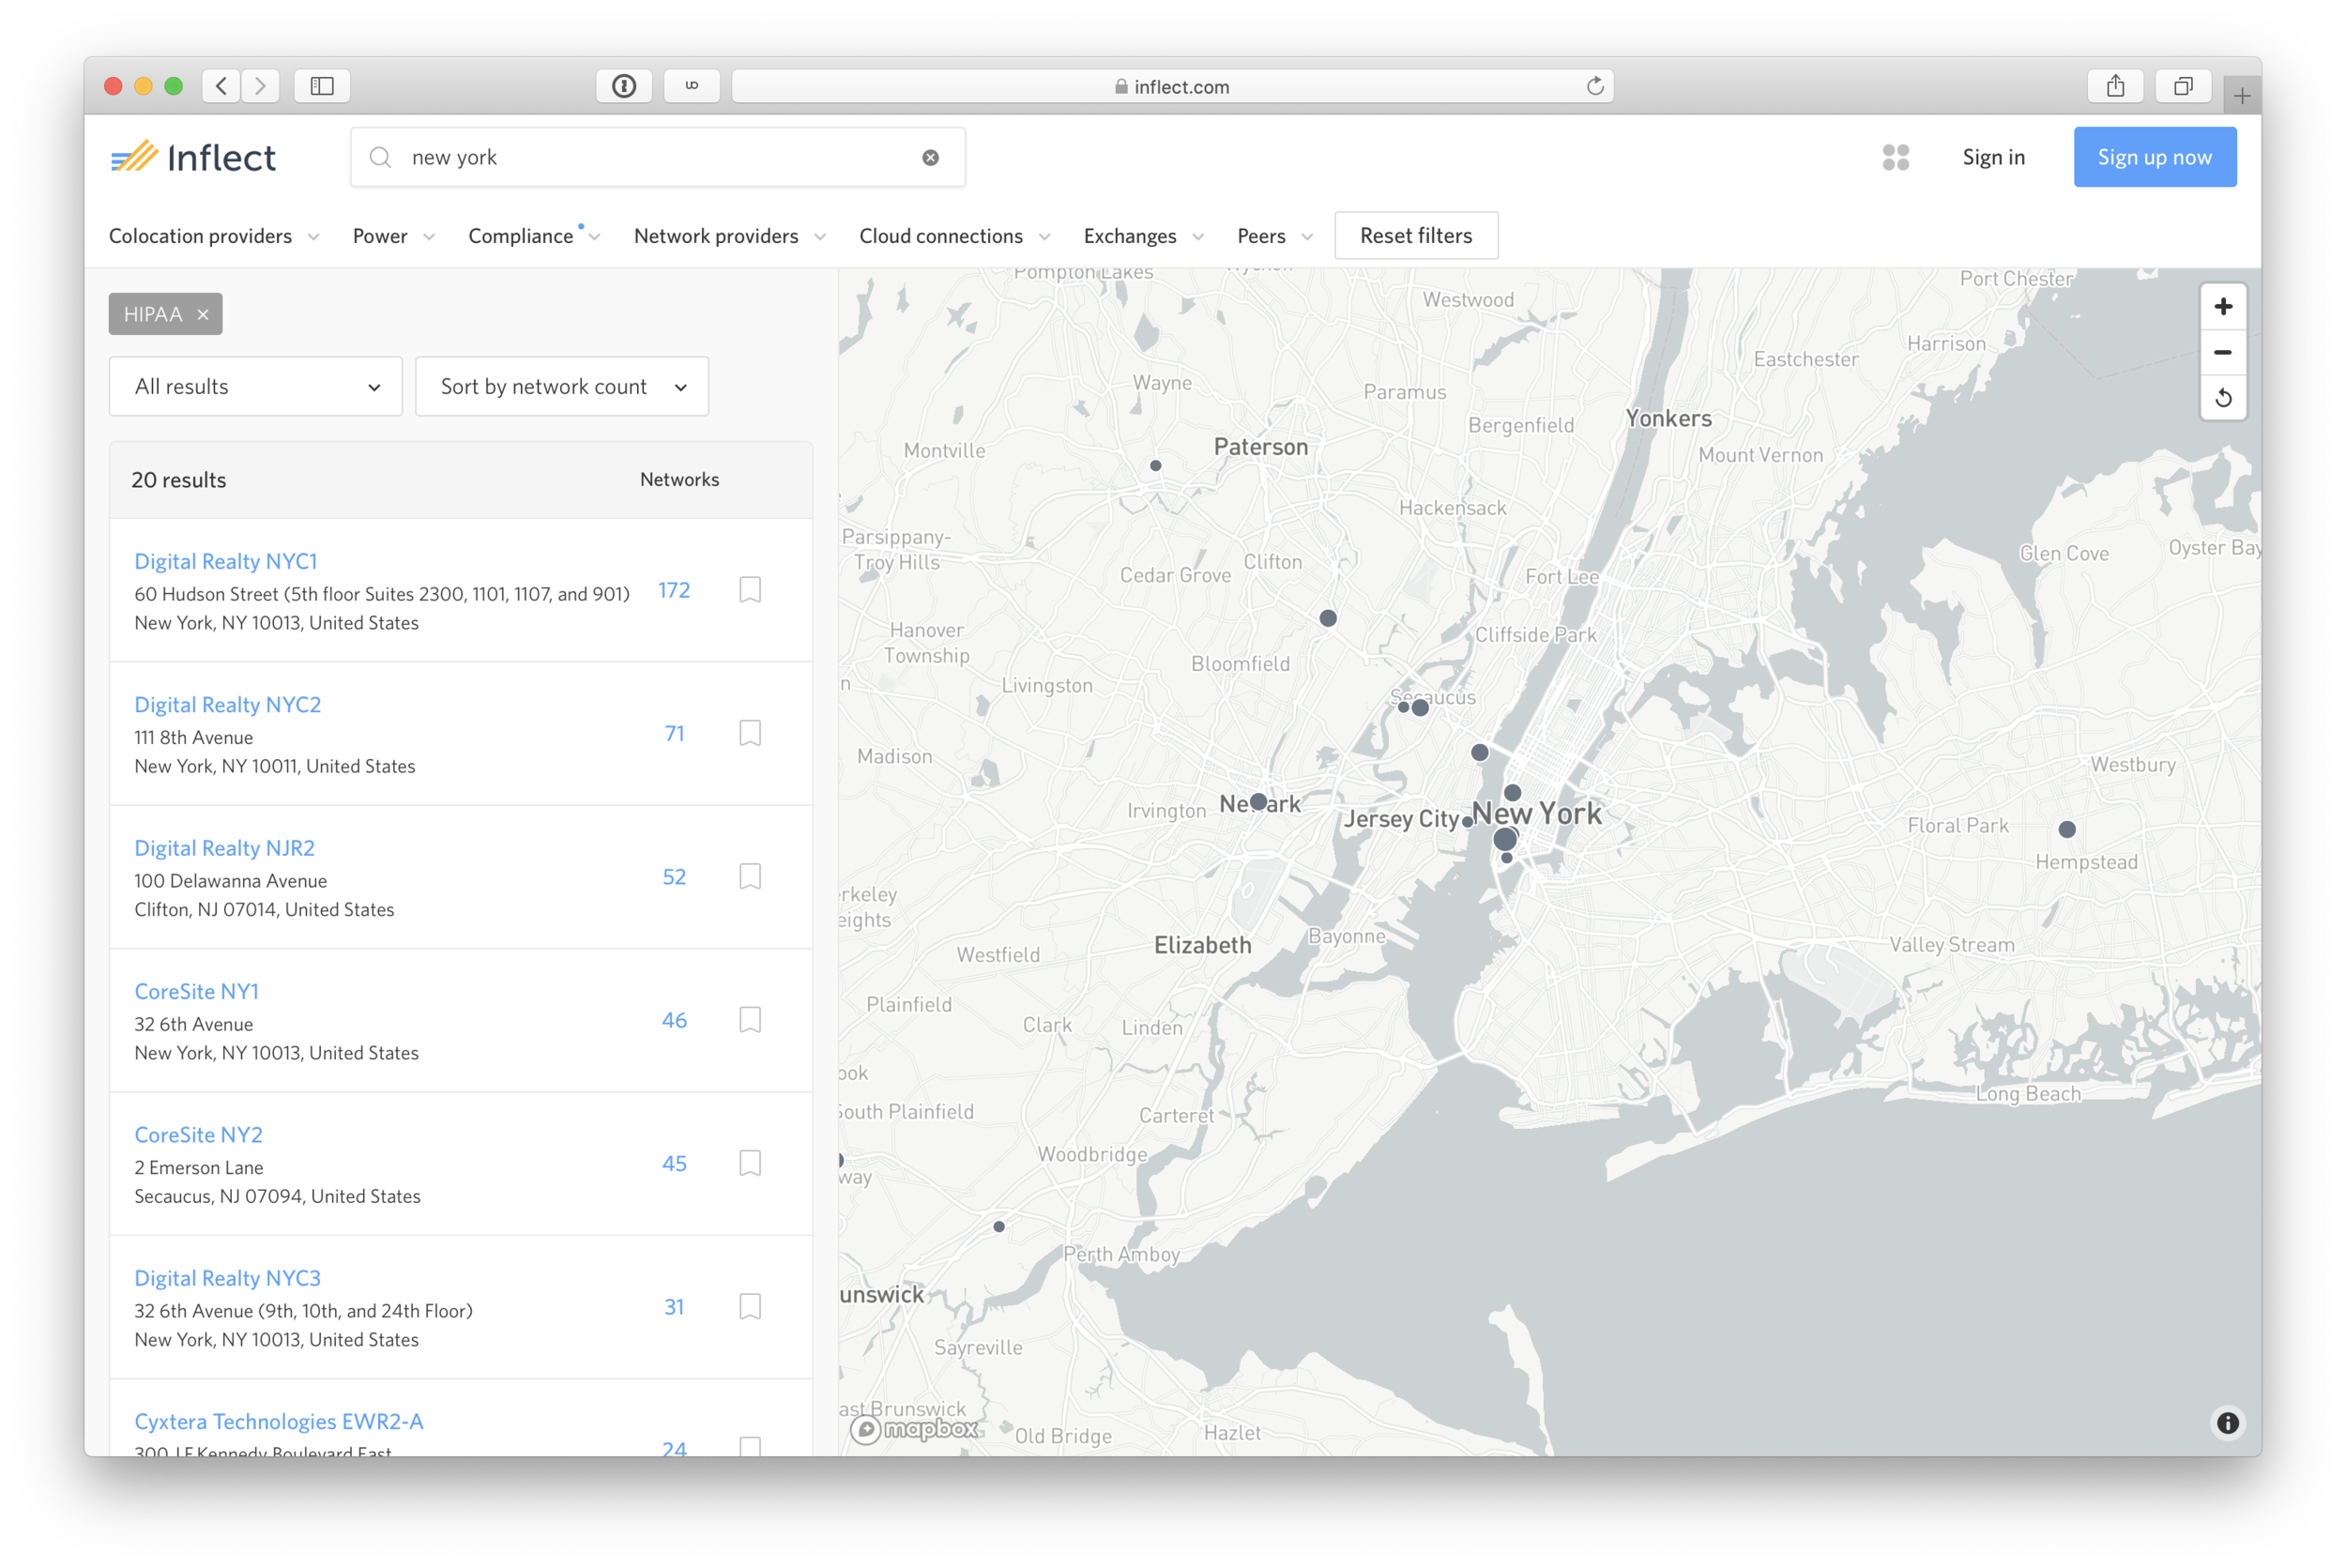
“Data centers in New York where CenturyLink is on-net”
Use case 2
Buyer handles sensitive data and must comply with regulatory standards.
“HIPAA-Compliant data centers”
Use case 3
Buyer has extraordinary power needs for cryptocurrency mining or machine learning applications.
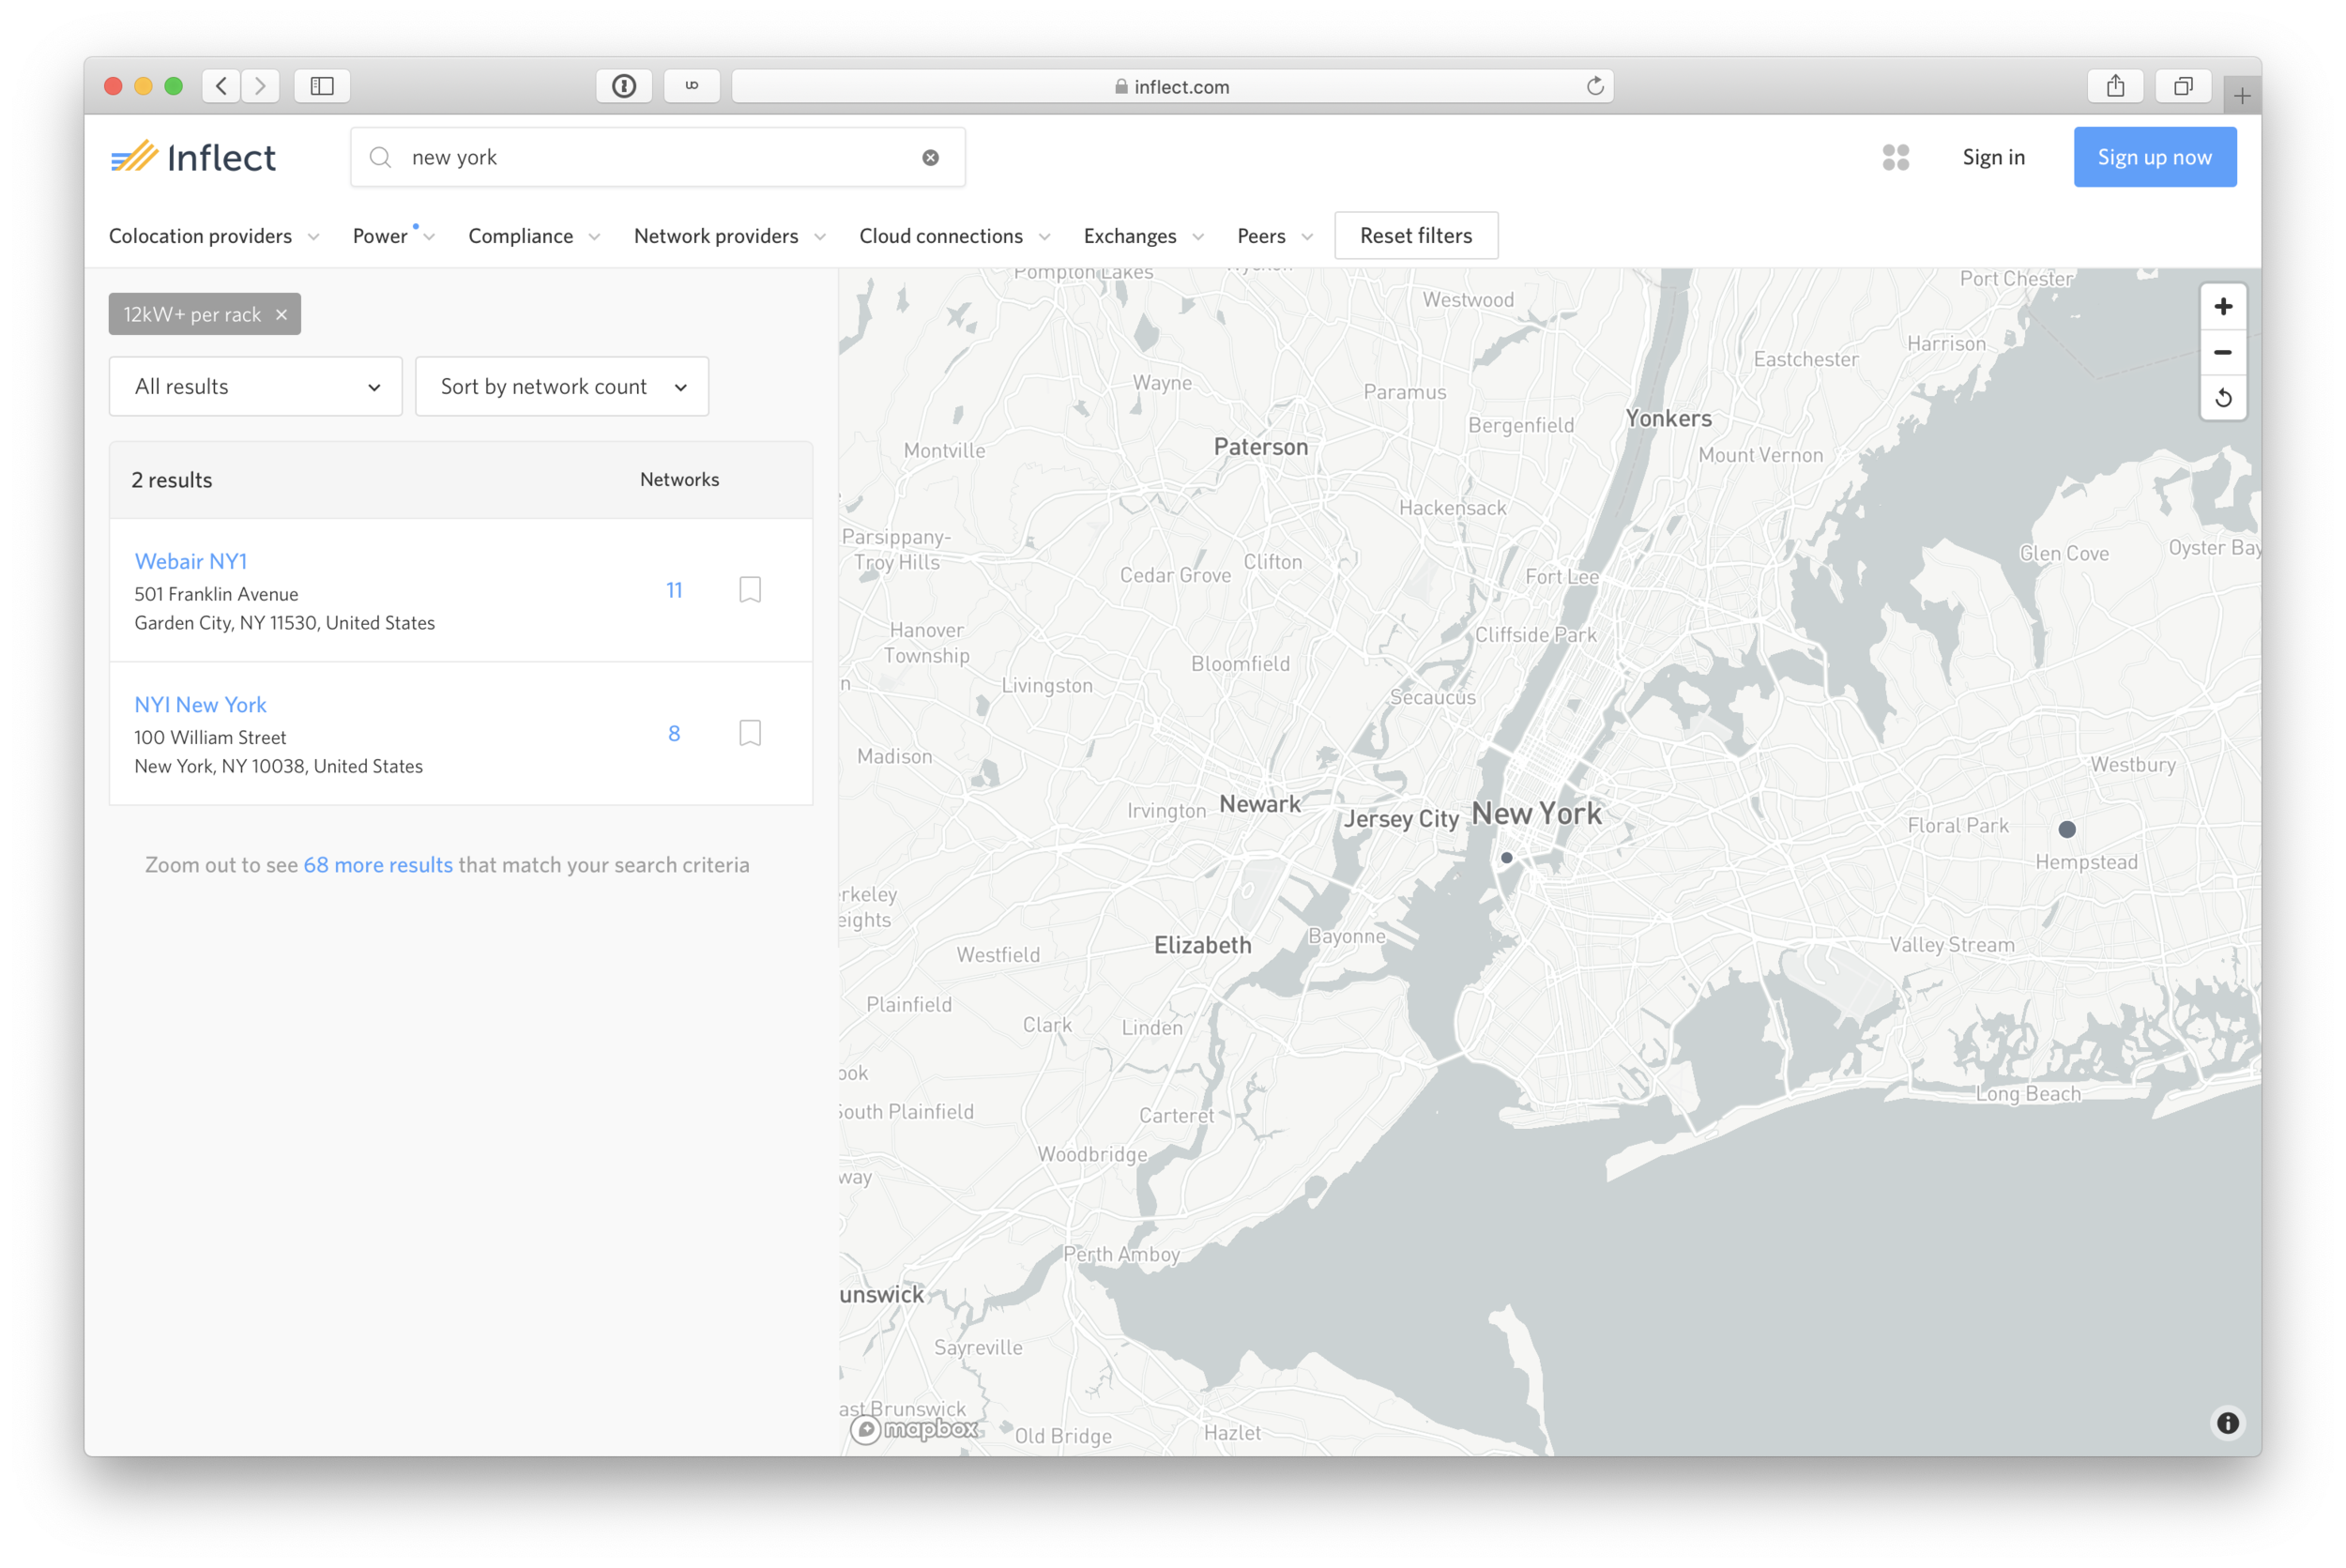
“Data centers with 12,000+ kW capacity per rack”
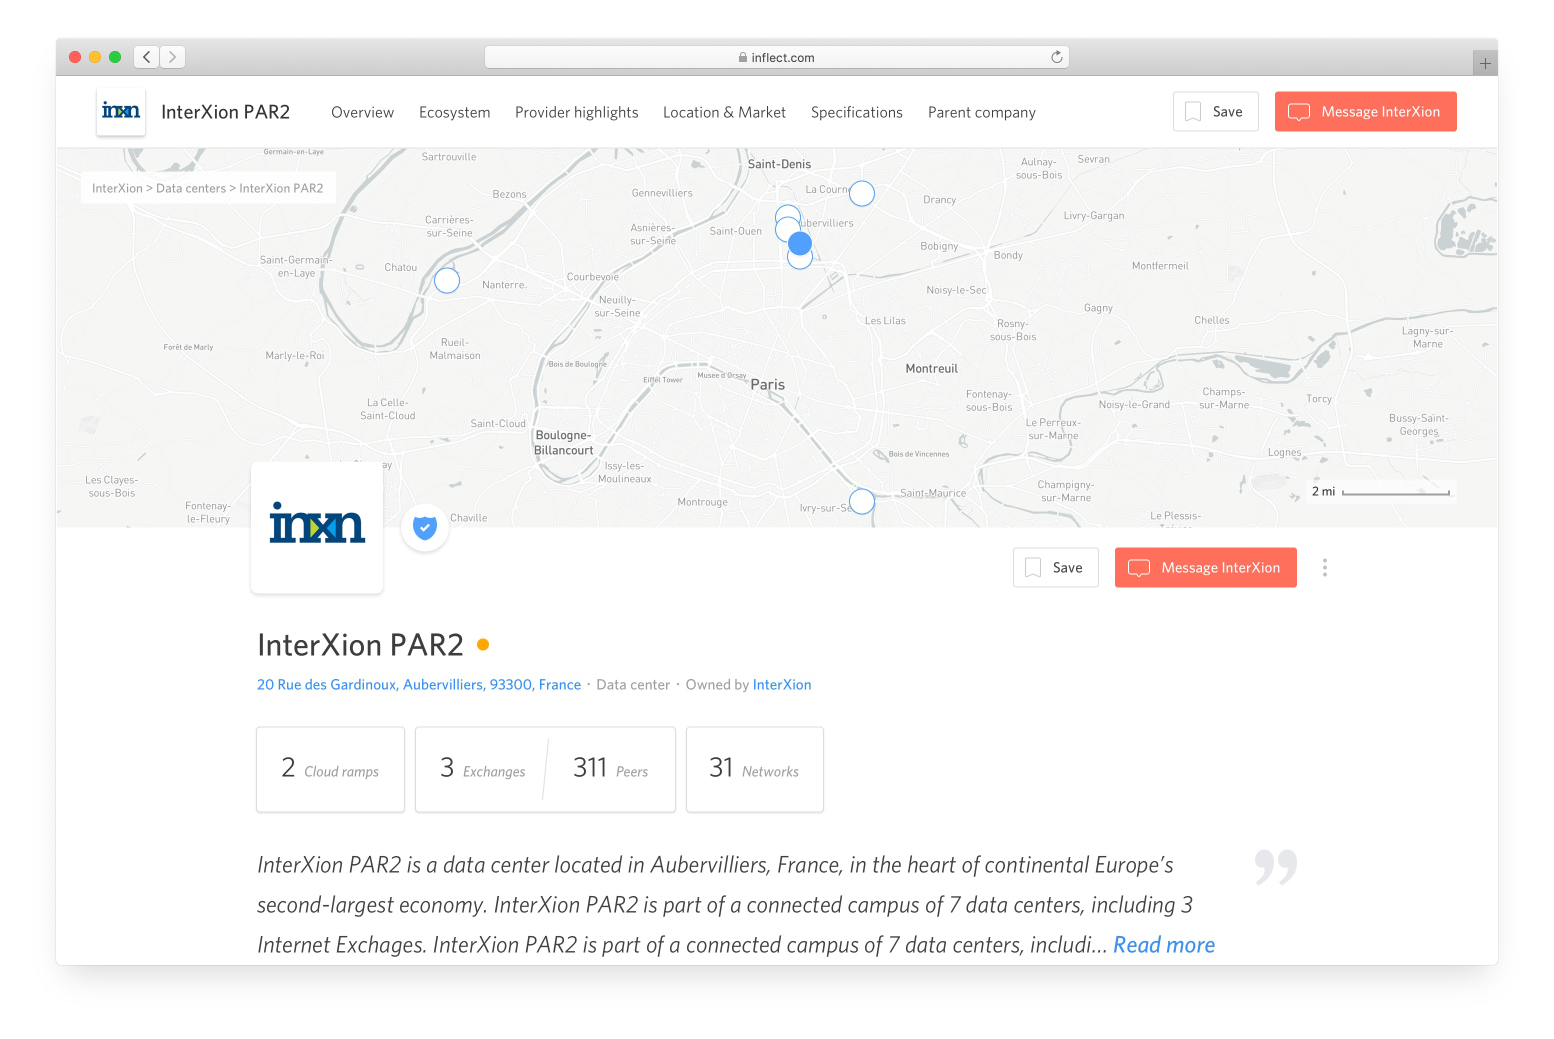
We iterated on our data center details pages, resulting in more quote requests and more returning visitors.
Buyers weren’t starting conversations with service providers as much as we expected, so we asked them why. We learned that the information they expected to see was difficult to find due to multiple tabs of the design, the button’s text felt too committal, and it was easy to overlook.
By updating the details page design, we saw an increase in the number of conversations with service providers, our users returned to the site more often, and service providers began to ask us if they could use our product to power their own internal sales tools and external customer portals because our UX was clearer to understand.
Initial, tabbed version
Separate tabs for each type of data. Top level attributes were focused on the characteristics of the building itself, such as the total space and power capacity.
Updated, single-page version
Based on user feedback we gave the pages a complete makeover, consolidating the tabs into a single page, re-prioritizing the presentation of data, and changing the top level stats to reflect the ecosystem details rather than the building specs.
“It’s about who else is at the data center. Which networks can I reach?” – Data center buyer
One discovery from our user feedback sessions was that the actual specifications of the data centers weren’t as interesting as we originally anticipated. What most people cared about was knowing which other networks and enterprises were located in each data center.
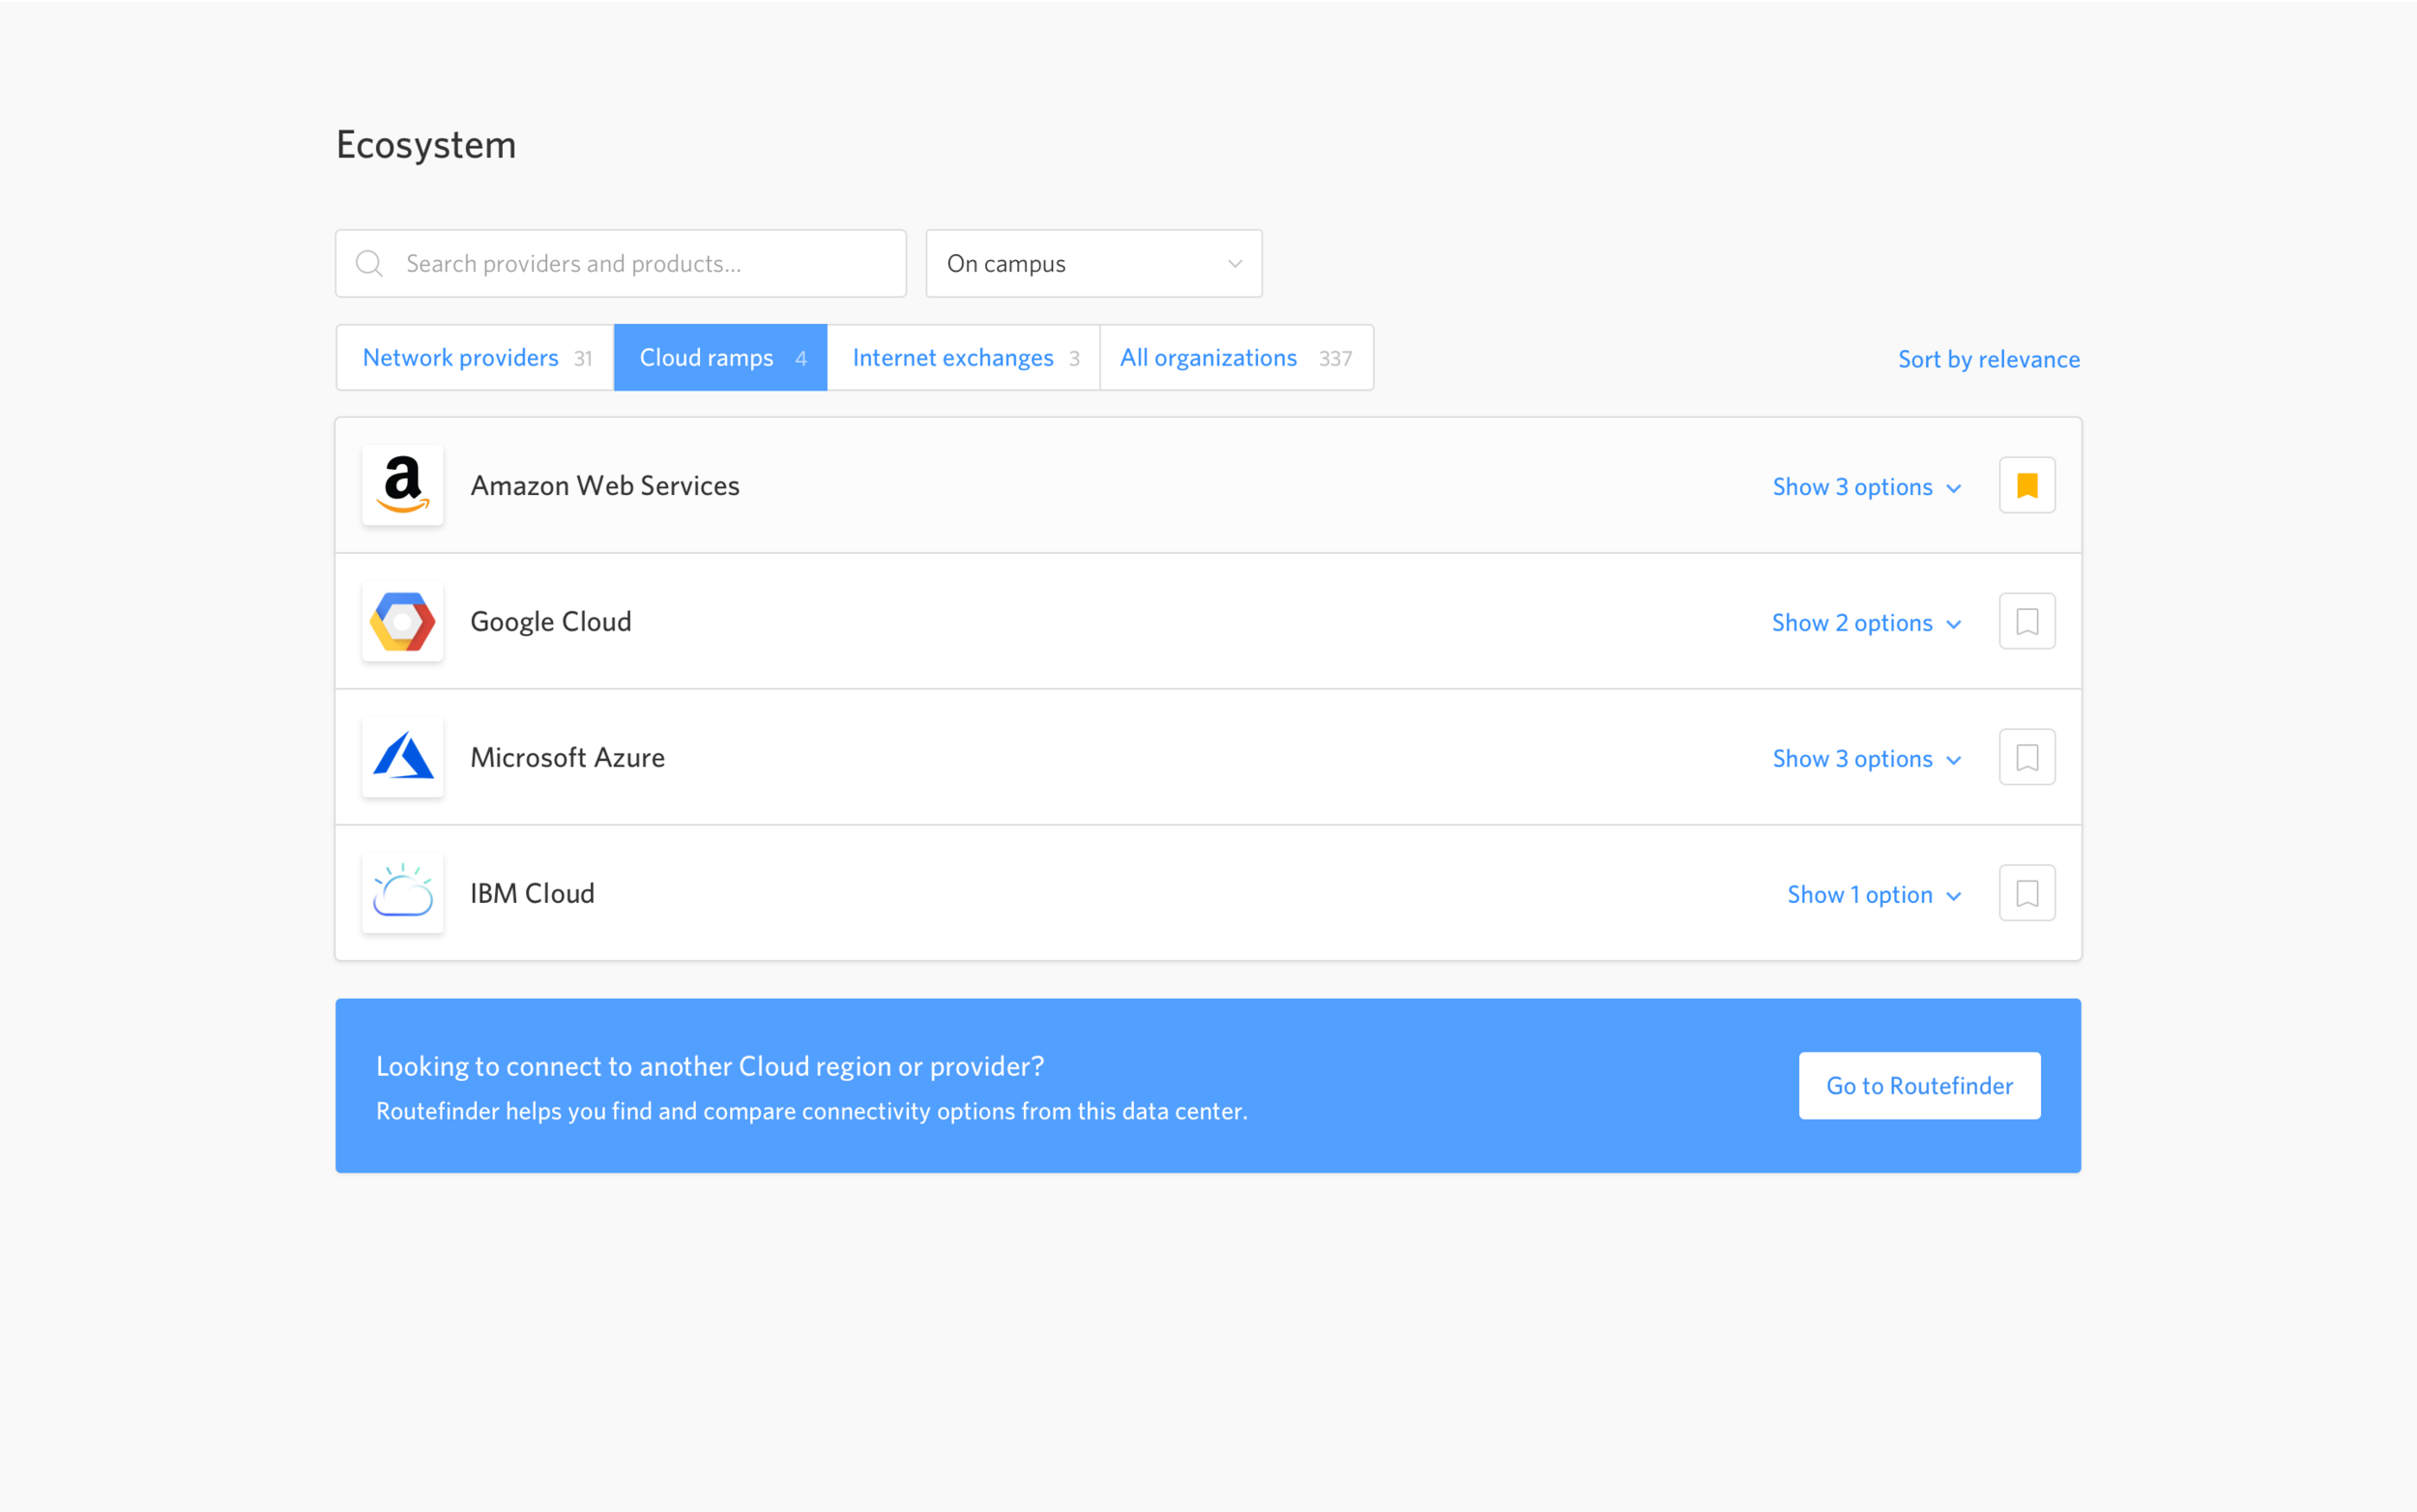
Based on our testing, we ended up shifting focus from the DC specifications to the ecosystem within each data center and creating a living map of who is where. Data center providers don’t have the ability to advertise everyone within their walls, but many of the tenants voluntarily share their location information through external services such as PeeringDB. We used these trusted 3rd party services to compliment the first party data we got from providers and ended up with a data set that far exceeded that of the data center providers themselves. Our data was also more up-to-date and cleaner than other data sets, but we needed to update how we presented it to users.
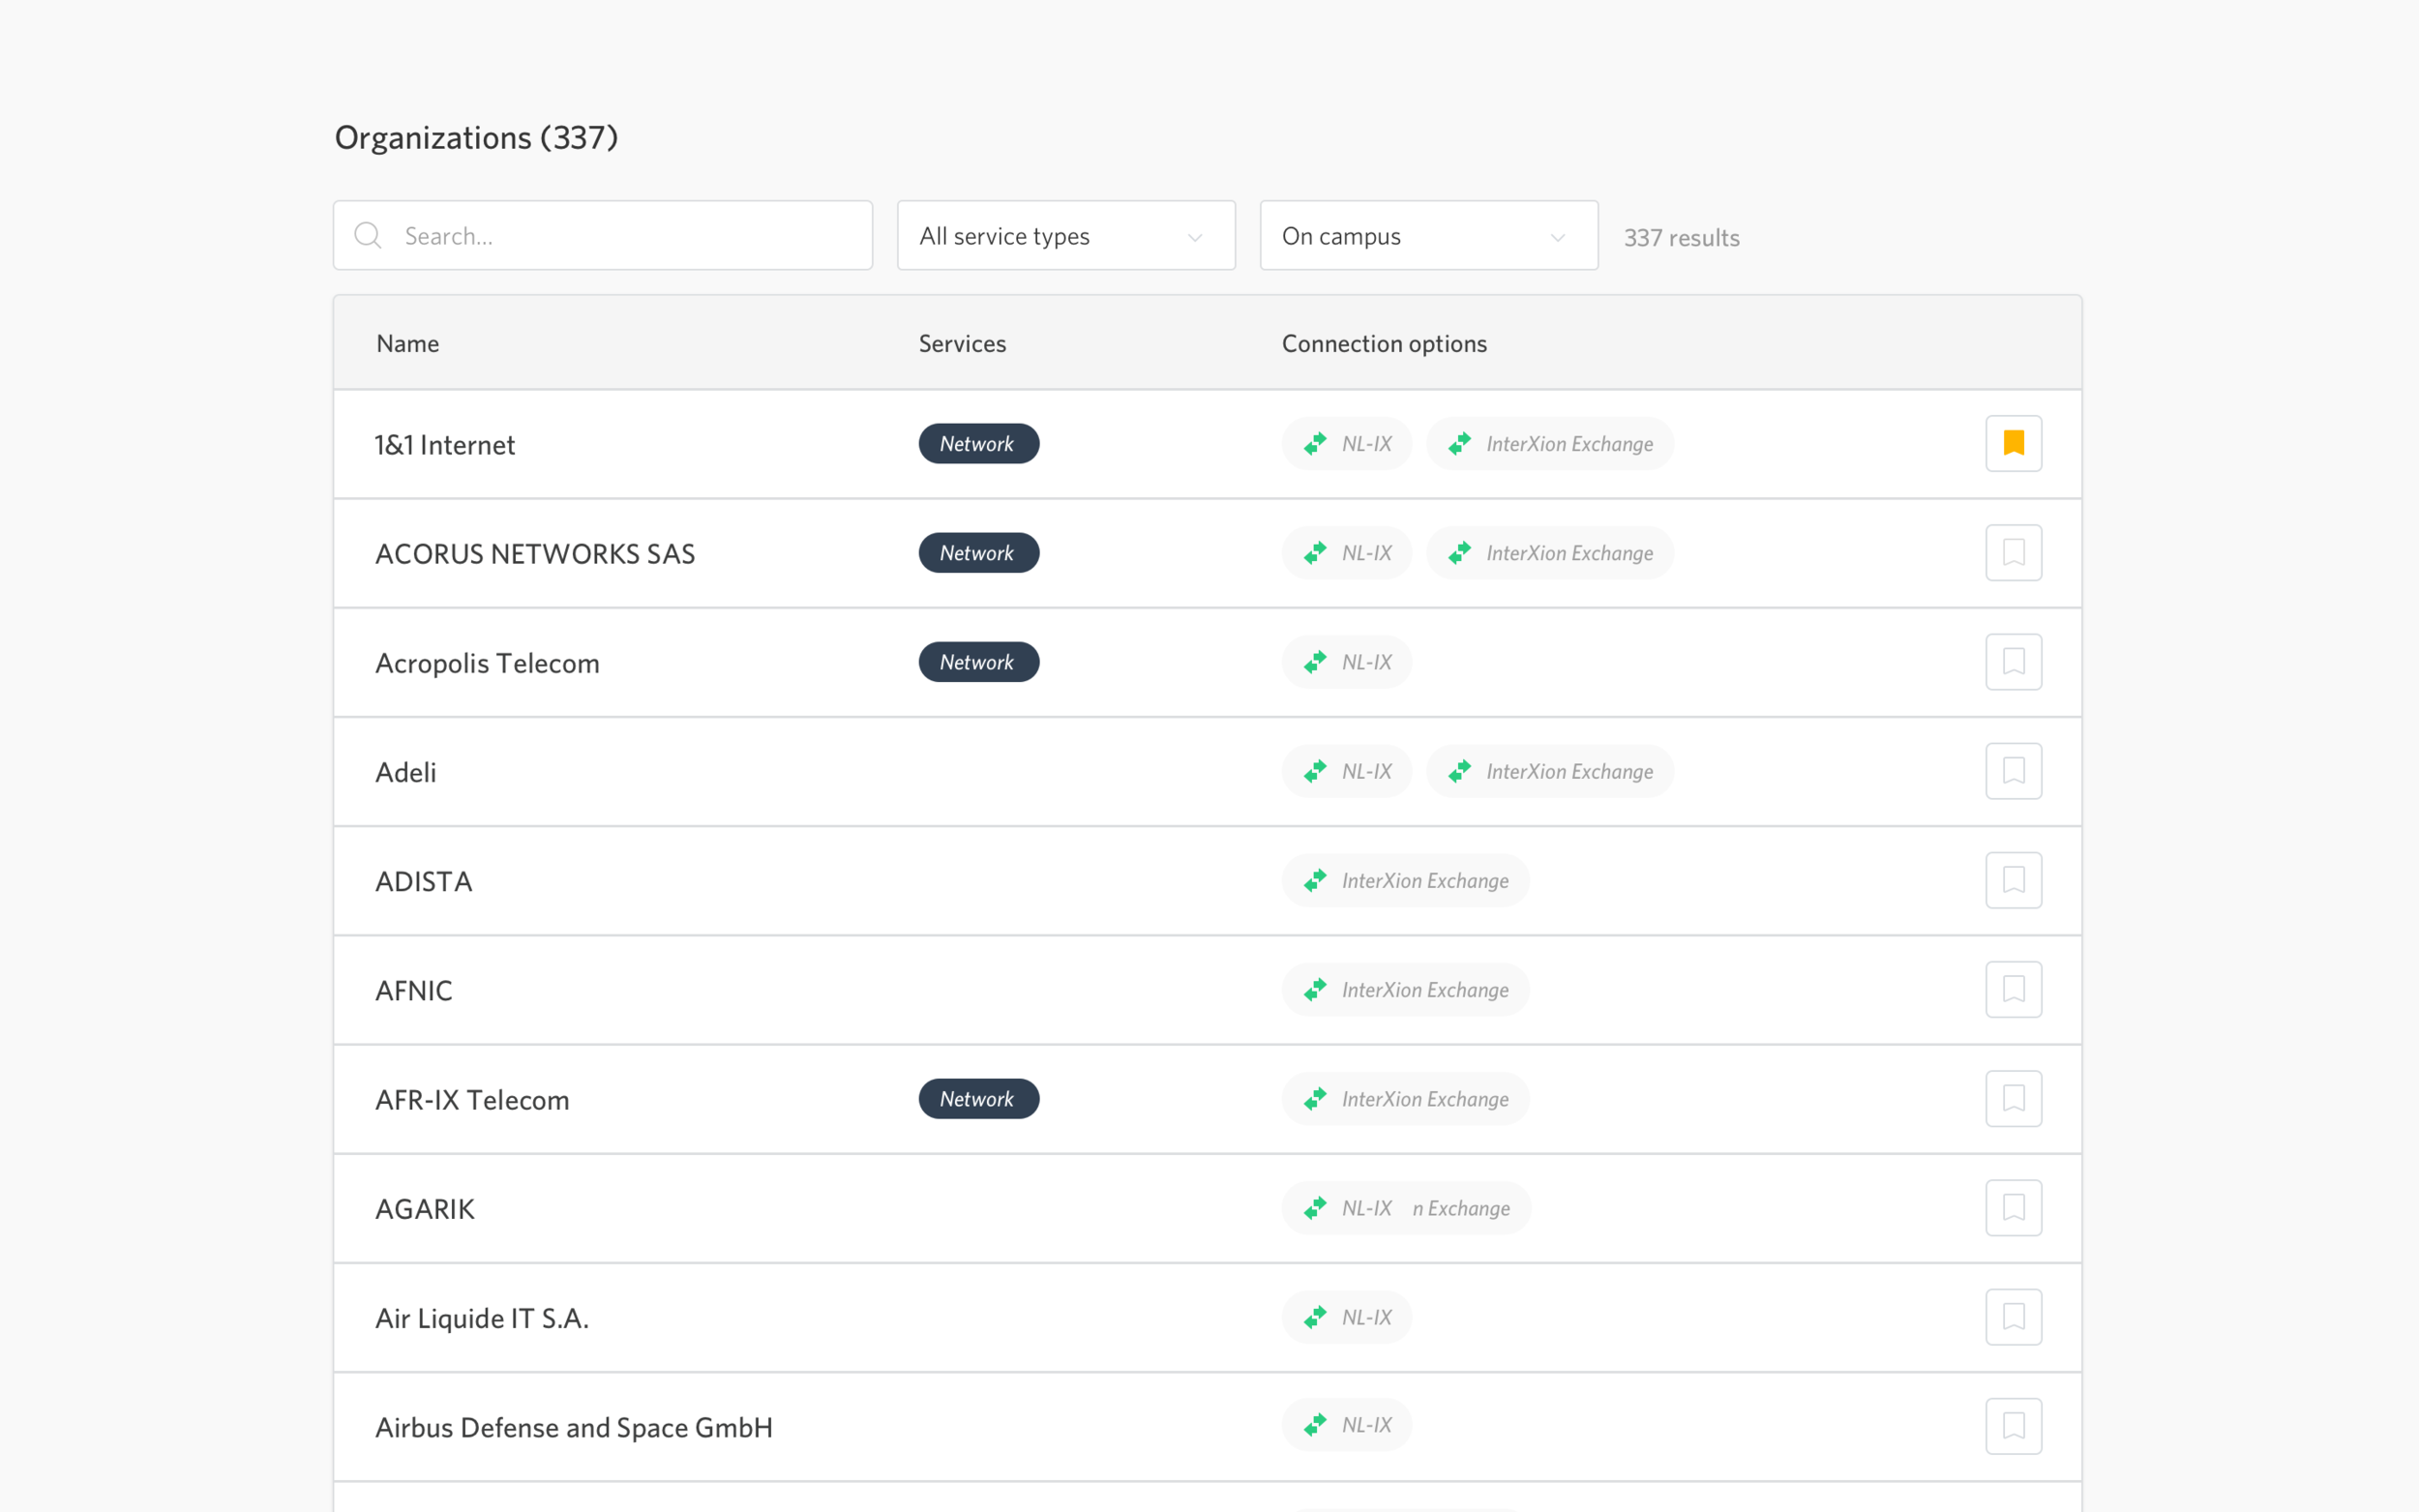
Initial, single list of all providers
All providers and products are listed together in a single list on the data center pages. A single list isn’t very useful since each type of provider has a very different offering.
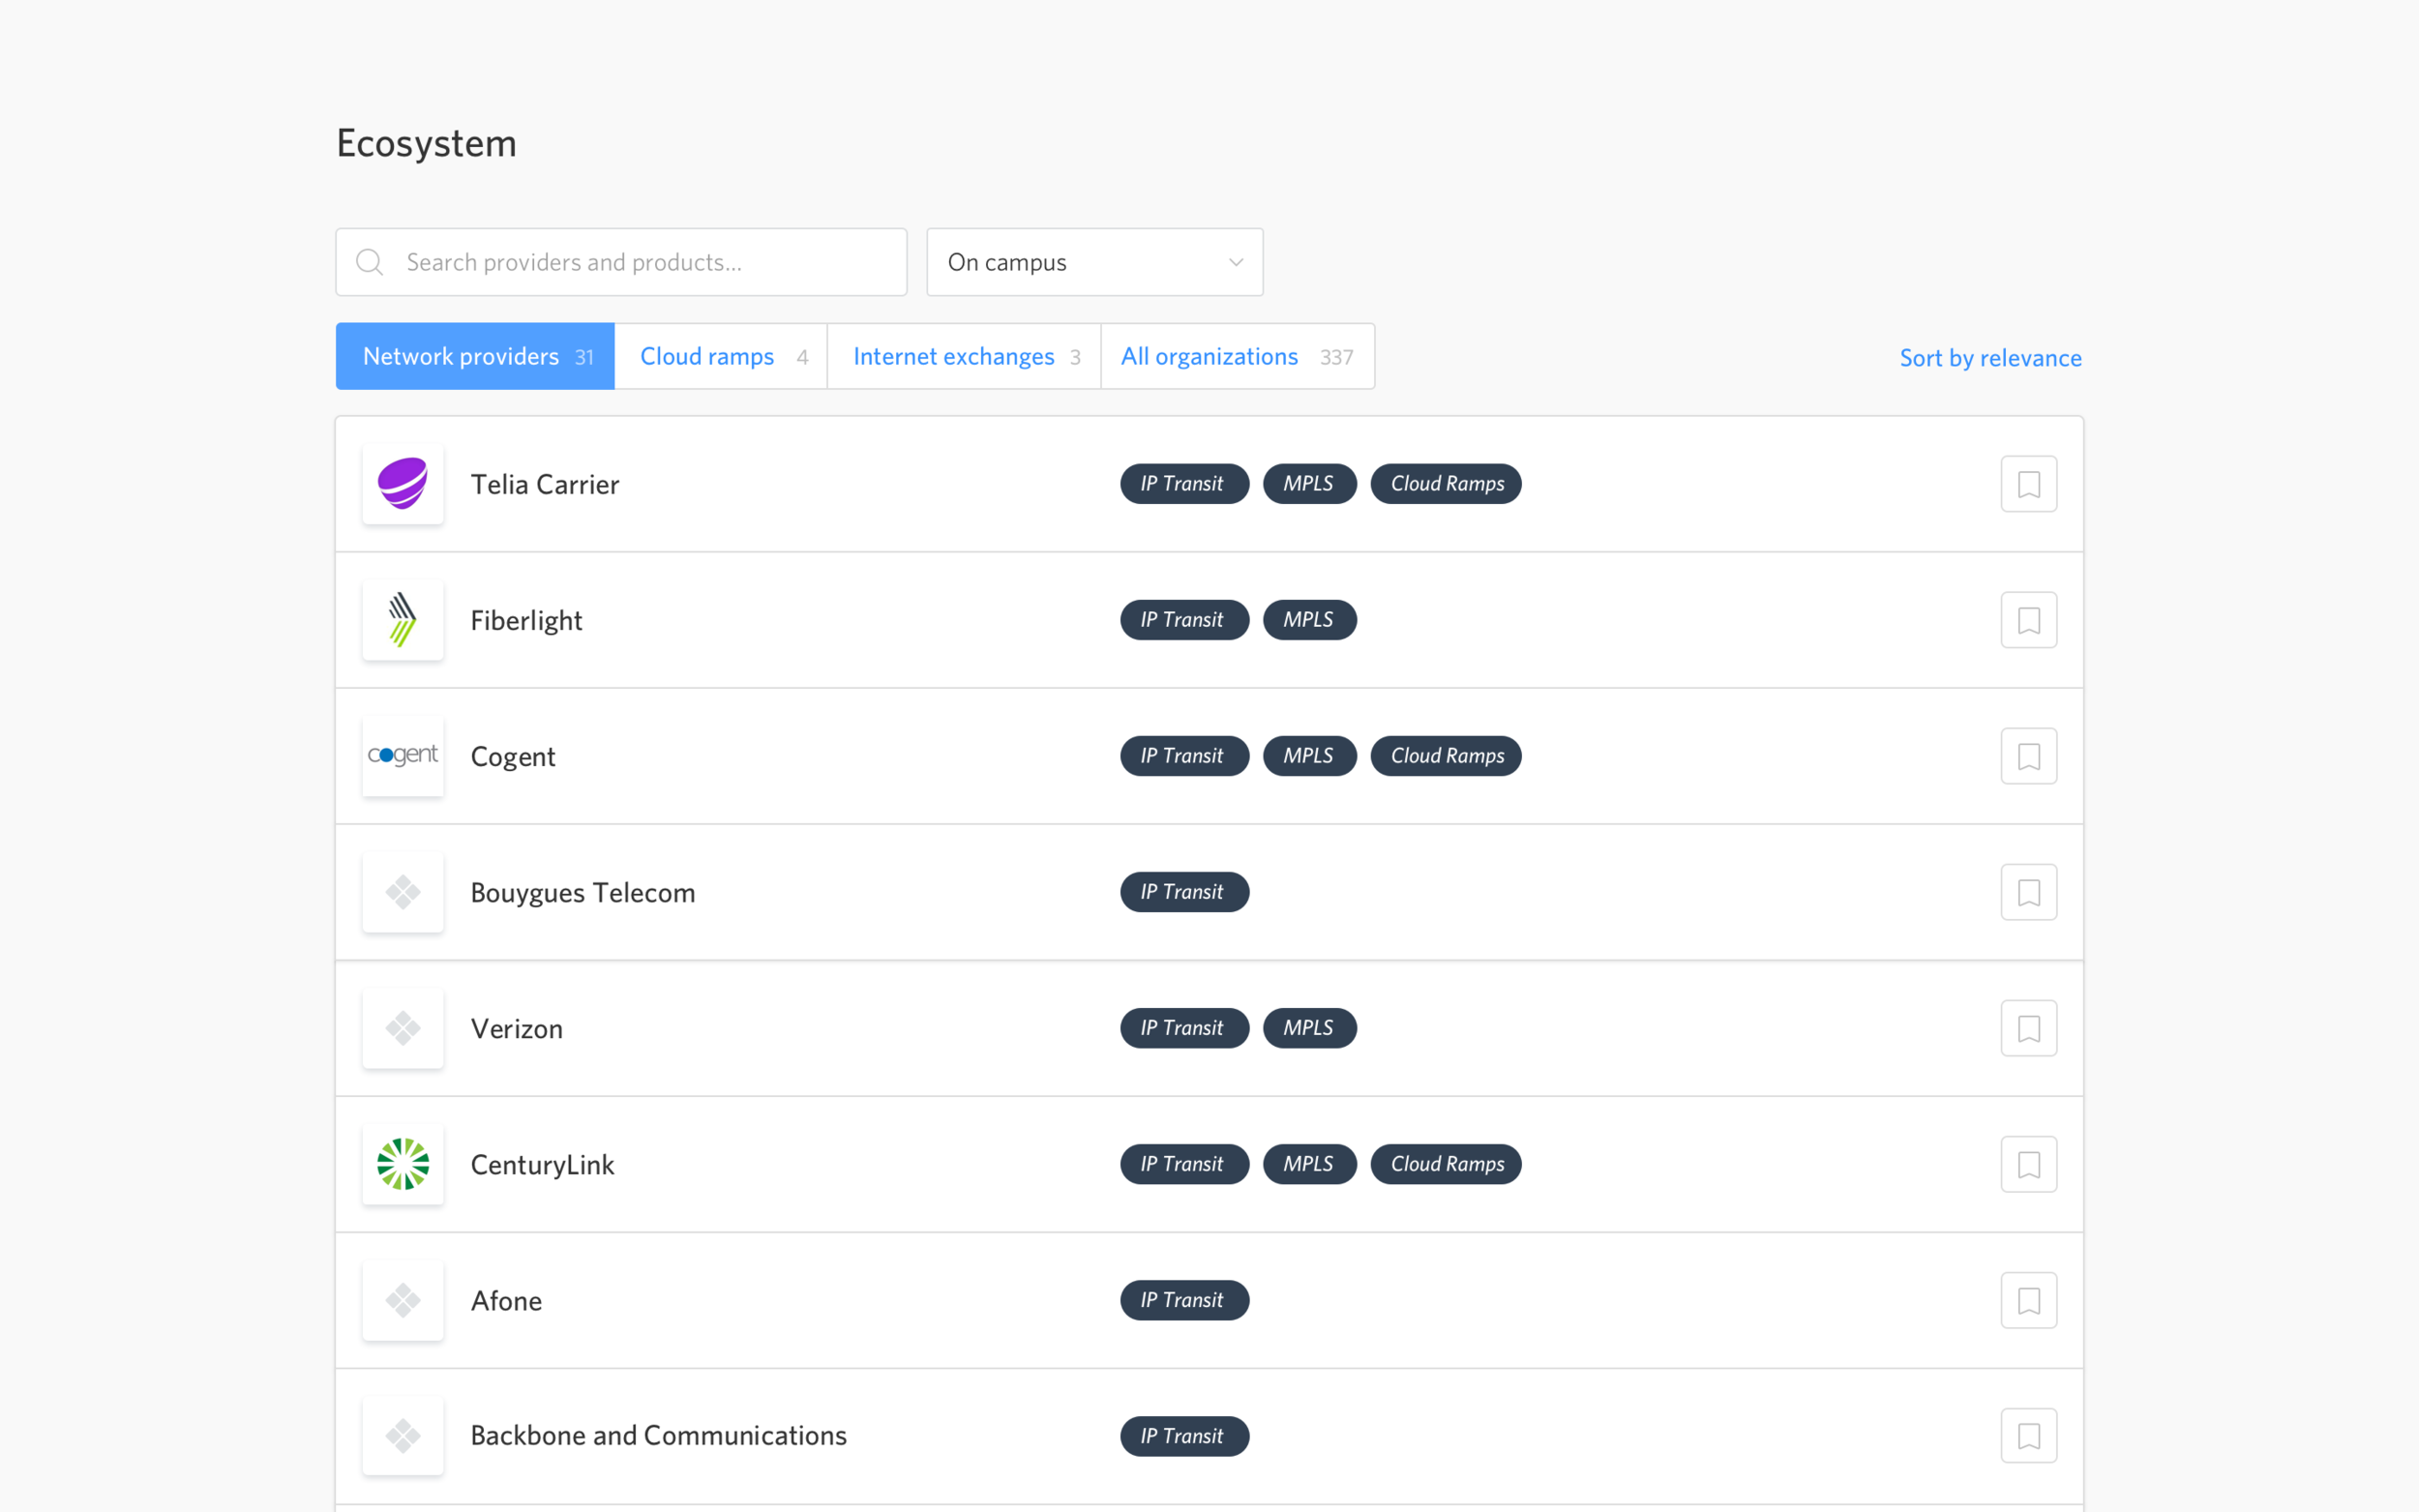
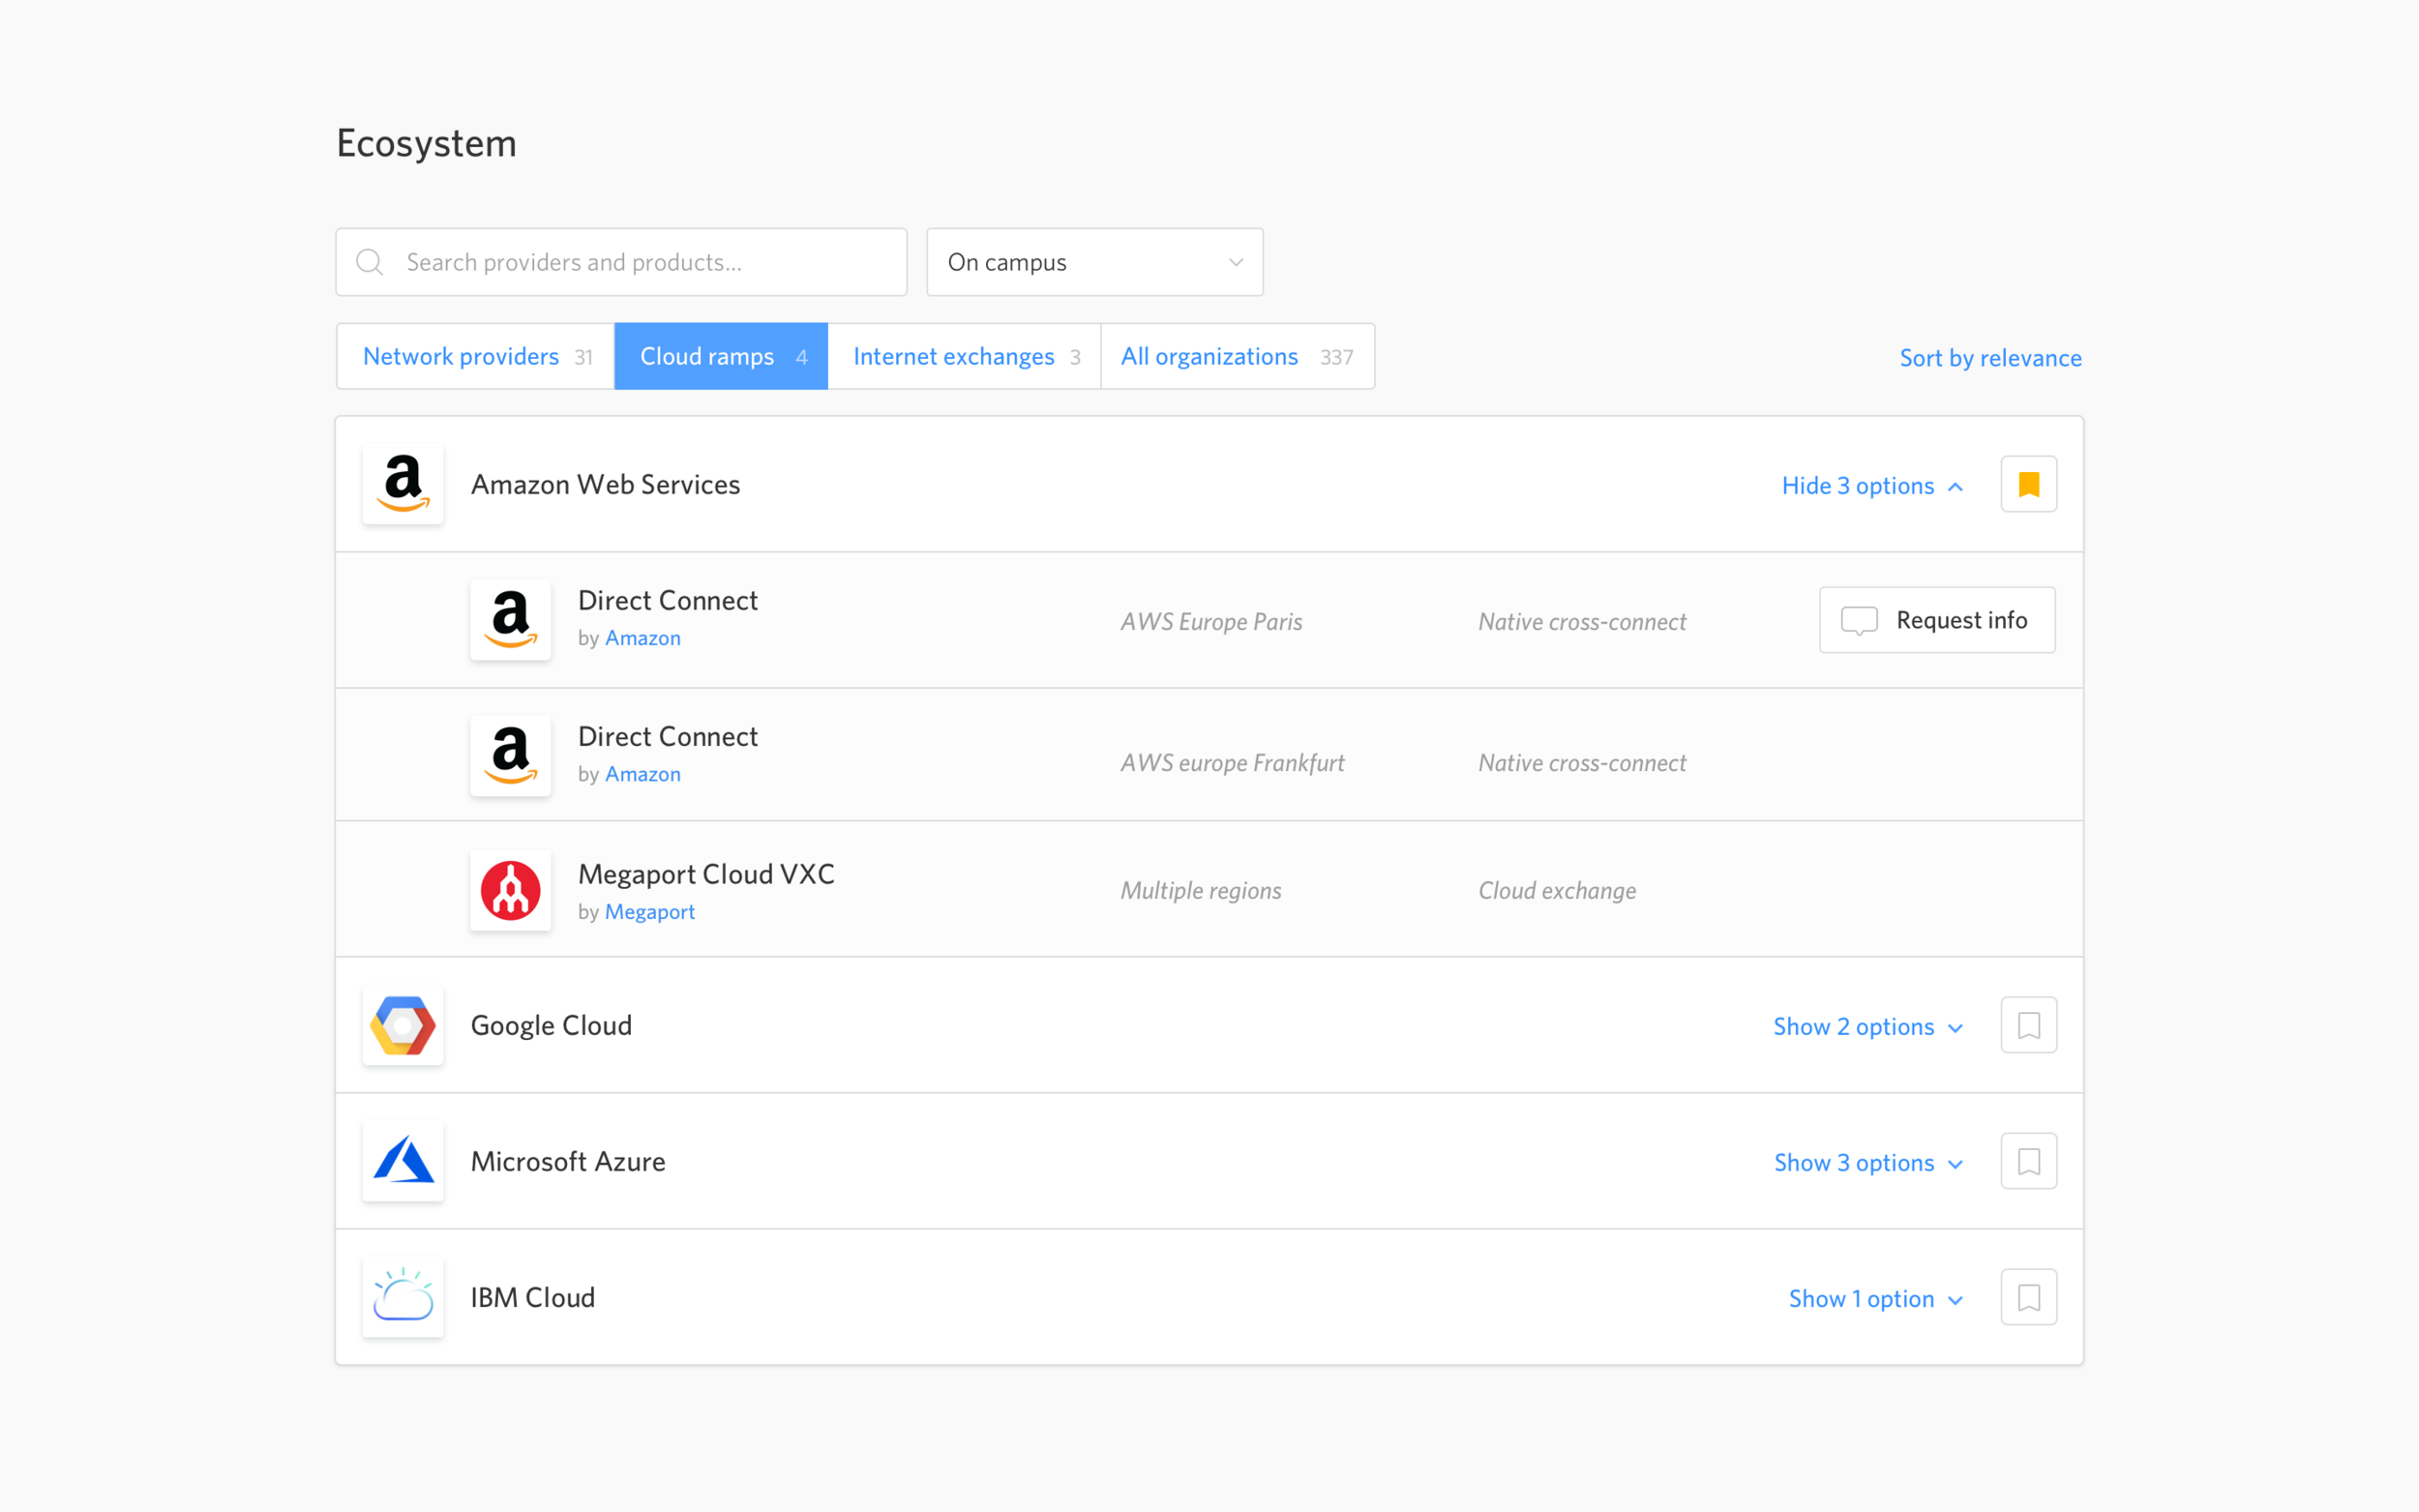

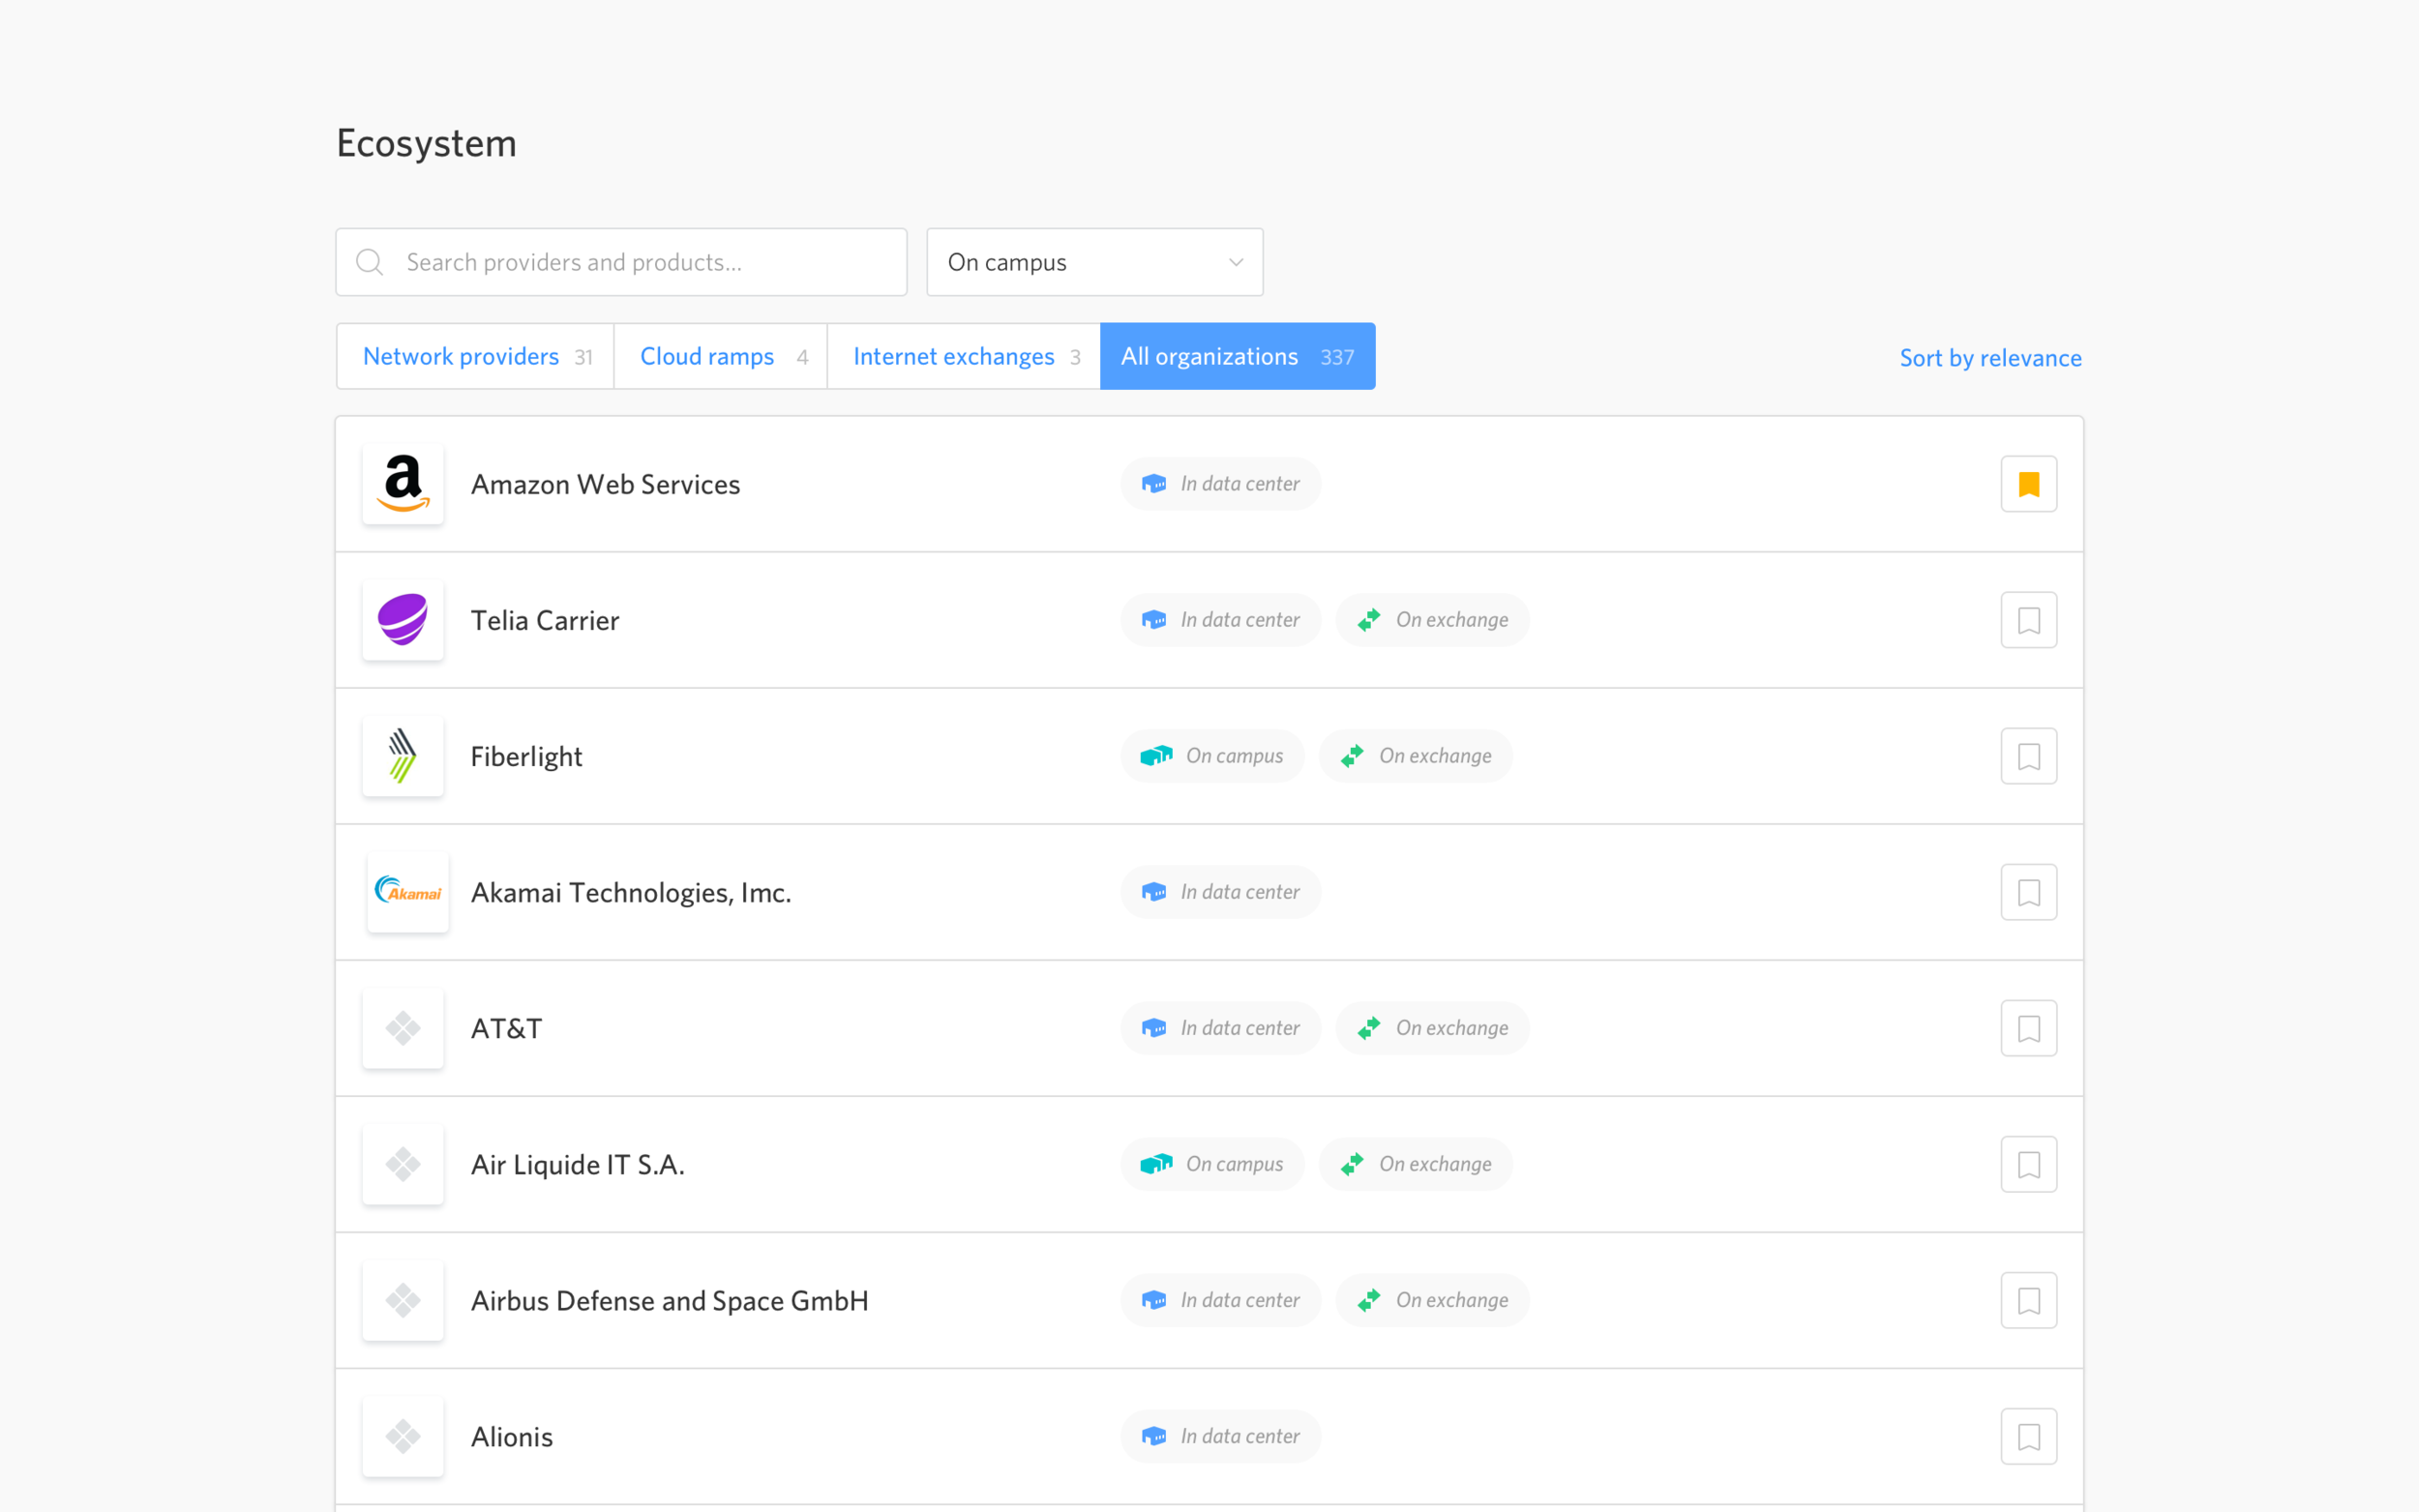
Updated list of providers by category
In the updated version, providers are viewable by type of services they offer. This version gives us more flexibility to display different metadata for each product type.
Routefinder product overview
A Kayak-like experience for point-to-point network connectivity.
Uncovering a new opportunity beyond data centers: network
As we spoke with more and more network engineers, we realized that we were sitting on another huge opportunity to not just sell data center services but help users connect their data centers together with network services as well. The data model we had already built for data centers lent itself perfectly to building the tools for network connectivity as well.
Buyer interviews revealed that the average Network Engineer purchases network connectivity far more often than data center space, and their complaints were often very similar to the problems we were already solving for data centers.
So my team got to work defining the basic requirements, sketching some basic ideas to communicate with the team, and then building prototypes to test with users.


Our ideas were met with enthusiasm – and skepticism that they were even possible to build.
Everyone we showed our ideas to said what we were proposing was something they always wished they had, and they all were skeptical that what we were proposing was even technically possible. Service providers were particularly excited about using the tool to better equip their own sales teams and speed up their “time to quota” (the time it takes for a new employee to become an expert).
With that validation, got to work refining the designs to make them easier to use and began working closely with Engineering to determine if they were technically feasible.
To make Routefinder real, we needed to map out the physical network connections for each type of route.
To ensure that our data model could power the queries we knew users would make, I sketched the different types of start and end points we wanted to enable and the connections that make up the ‘routes’ from end to end.
Early map of different types of routes between endpoints. Different types of connections are represented by different colored lines.
We visualized each route by segment to give buyers a better understanding of the route.
Each route is made up of what we referred to as “handoffs” or “demarcation points” – where one service provider’s responsibilities ends and another’s begins. It’s important for users to understand how each segment of the route worked and the type of connection product for each segment because those characteristics could drastically affect pricing and network performance.

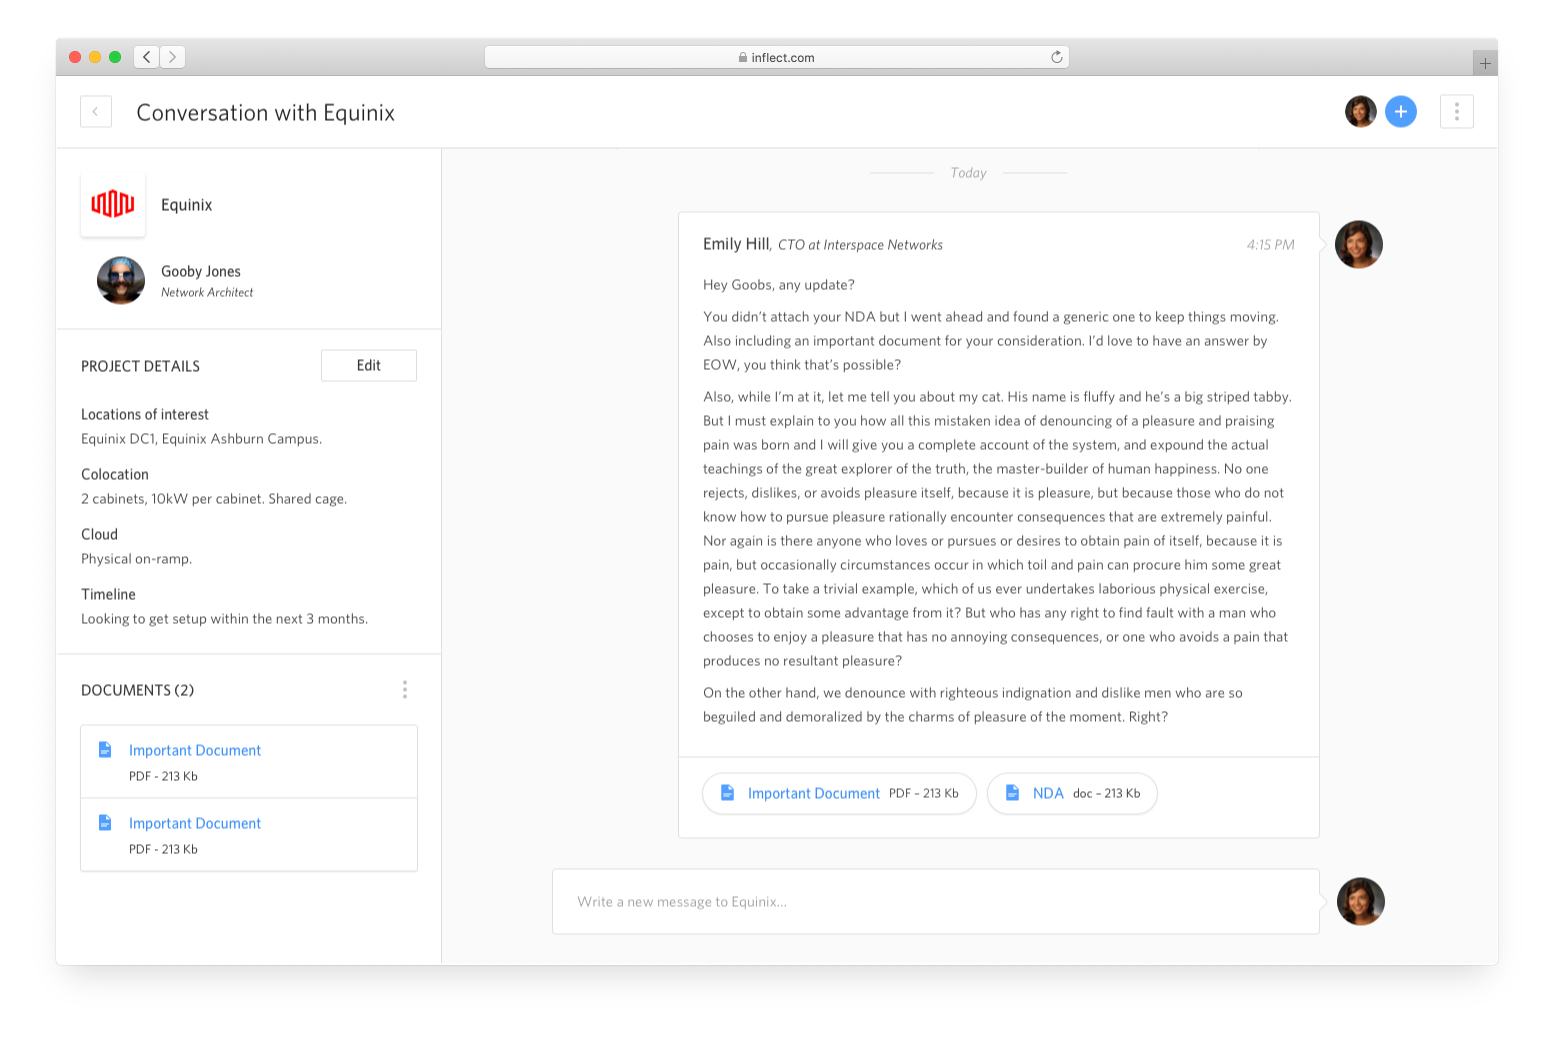
We made purchasing each route as quick and simple as possible.
Purchasing a single connection between two endpoints involves the buyer coordinating with multiple service providers. We designed a module for requesting pricing from providers that is flexible enough to handle many different types of products and services.


Lessons from our closed Routefinder Alpha feedback sessions
Buyers and sellers need this tool and are willing to pay $200/month for it.
During the alpha testing I set up offer testing sessions with prospective customers to understand how much value they assign to the product, in addition to making sure our approach aligned with how buyers and sellers think about the problem.
We asked the question: “Based on your experience using the product so far, what would you expect it to cost?” followed by: “How likely would you be to buy at that price?” and set the price based on the ranges of responses we heard.
Recover gracefully from poor search results and find clever ways to prevent poor results entirely.
We noticed through user testing and analytics data that many of our Alpha users had poor results for their first queries, and most of those poor experiences could have been prevented. Someone may enter the common name of a data center, but if that name happens to be an address (often the case) then we
To improve our search experience, I sketched and prototyped approaches to present people with more context around the endpoints they’re selecting, in the autocomplete experience and on the search result page. I also sketched approaches for giving users the ability to disambiguate their selection on the results page if there were many relevant entities for the query.

Users want to request pricing from multiple providers at once.
Selecting a provider from the search results page is cumbersome if the buyer is interested in getting pricing from multiple of those providers at once. If I had a chance to go back and iterate, I would have liked to move the provider selection to the details page instead of the search results.
We need more data to provide value to the typical network buyer.
Our data center data was highly regarded and mostly complete, but our enterprise address data set wasn’t complete enough for the average buyer to find it useful for connecting their office locations to their data centers. Network operators sometimes have hundreds of thousands or even millions of service locations globally – an amount we could never index with the pace of our current rigorous and manual process. We needed to find a new way to approach enterprise addresses if we were going to build the tool that our users were telling us they needed.
Strategic Shift from single product to suite of products
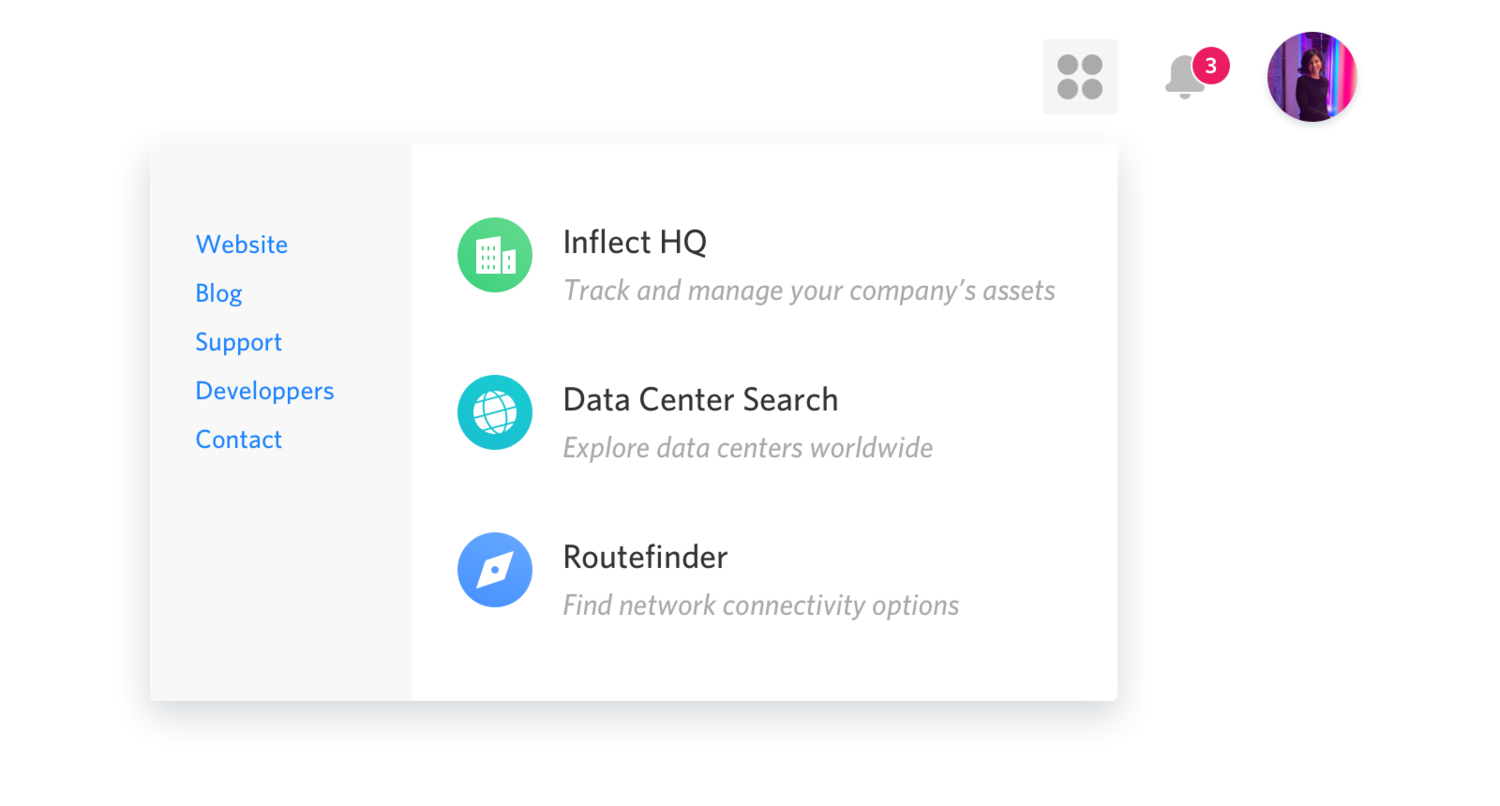
As our Routefinder product became closer to a reality, we began thinking about how to integrate it more fully into the data center marketplace we’d already created. We knew that initially they’d need to be able to stand independently, so we decided to create a system that could expand as we added other new products and tools on our roadmap.
We designed an app switcher to help people quickly jump between our growing product suite and help both buyers and sellers see that we’re thinking much bigger than just a data center marketplace.
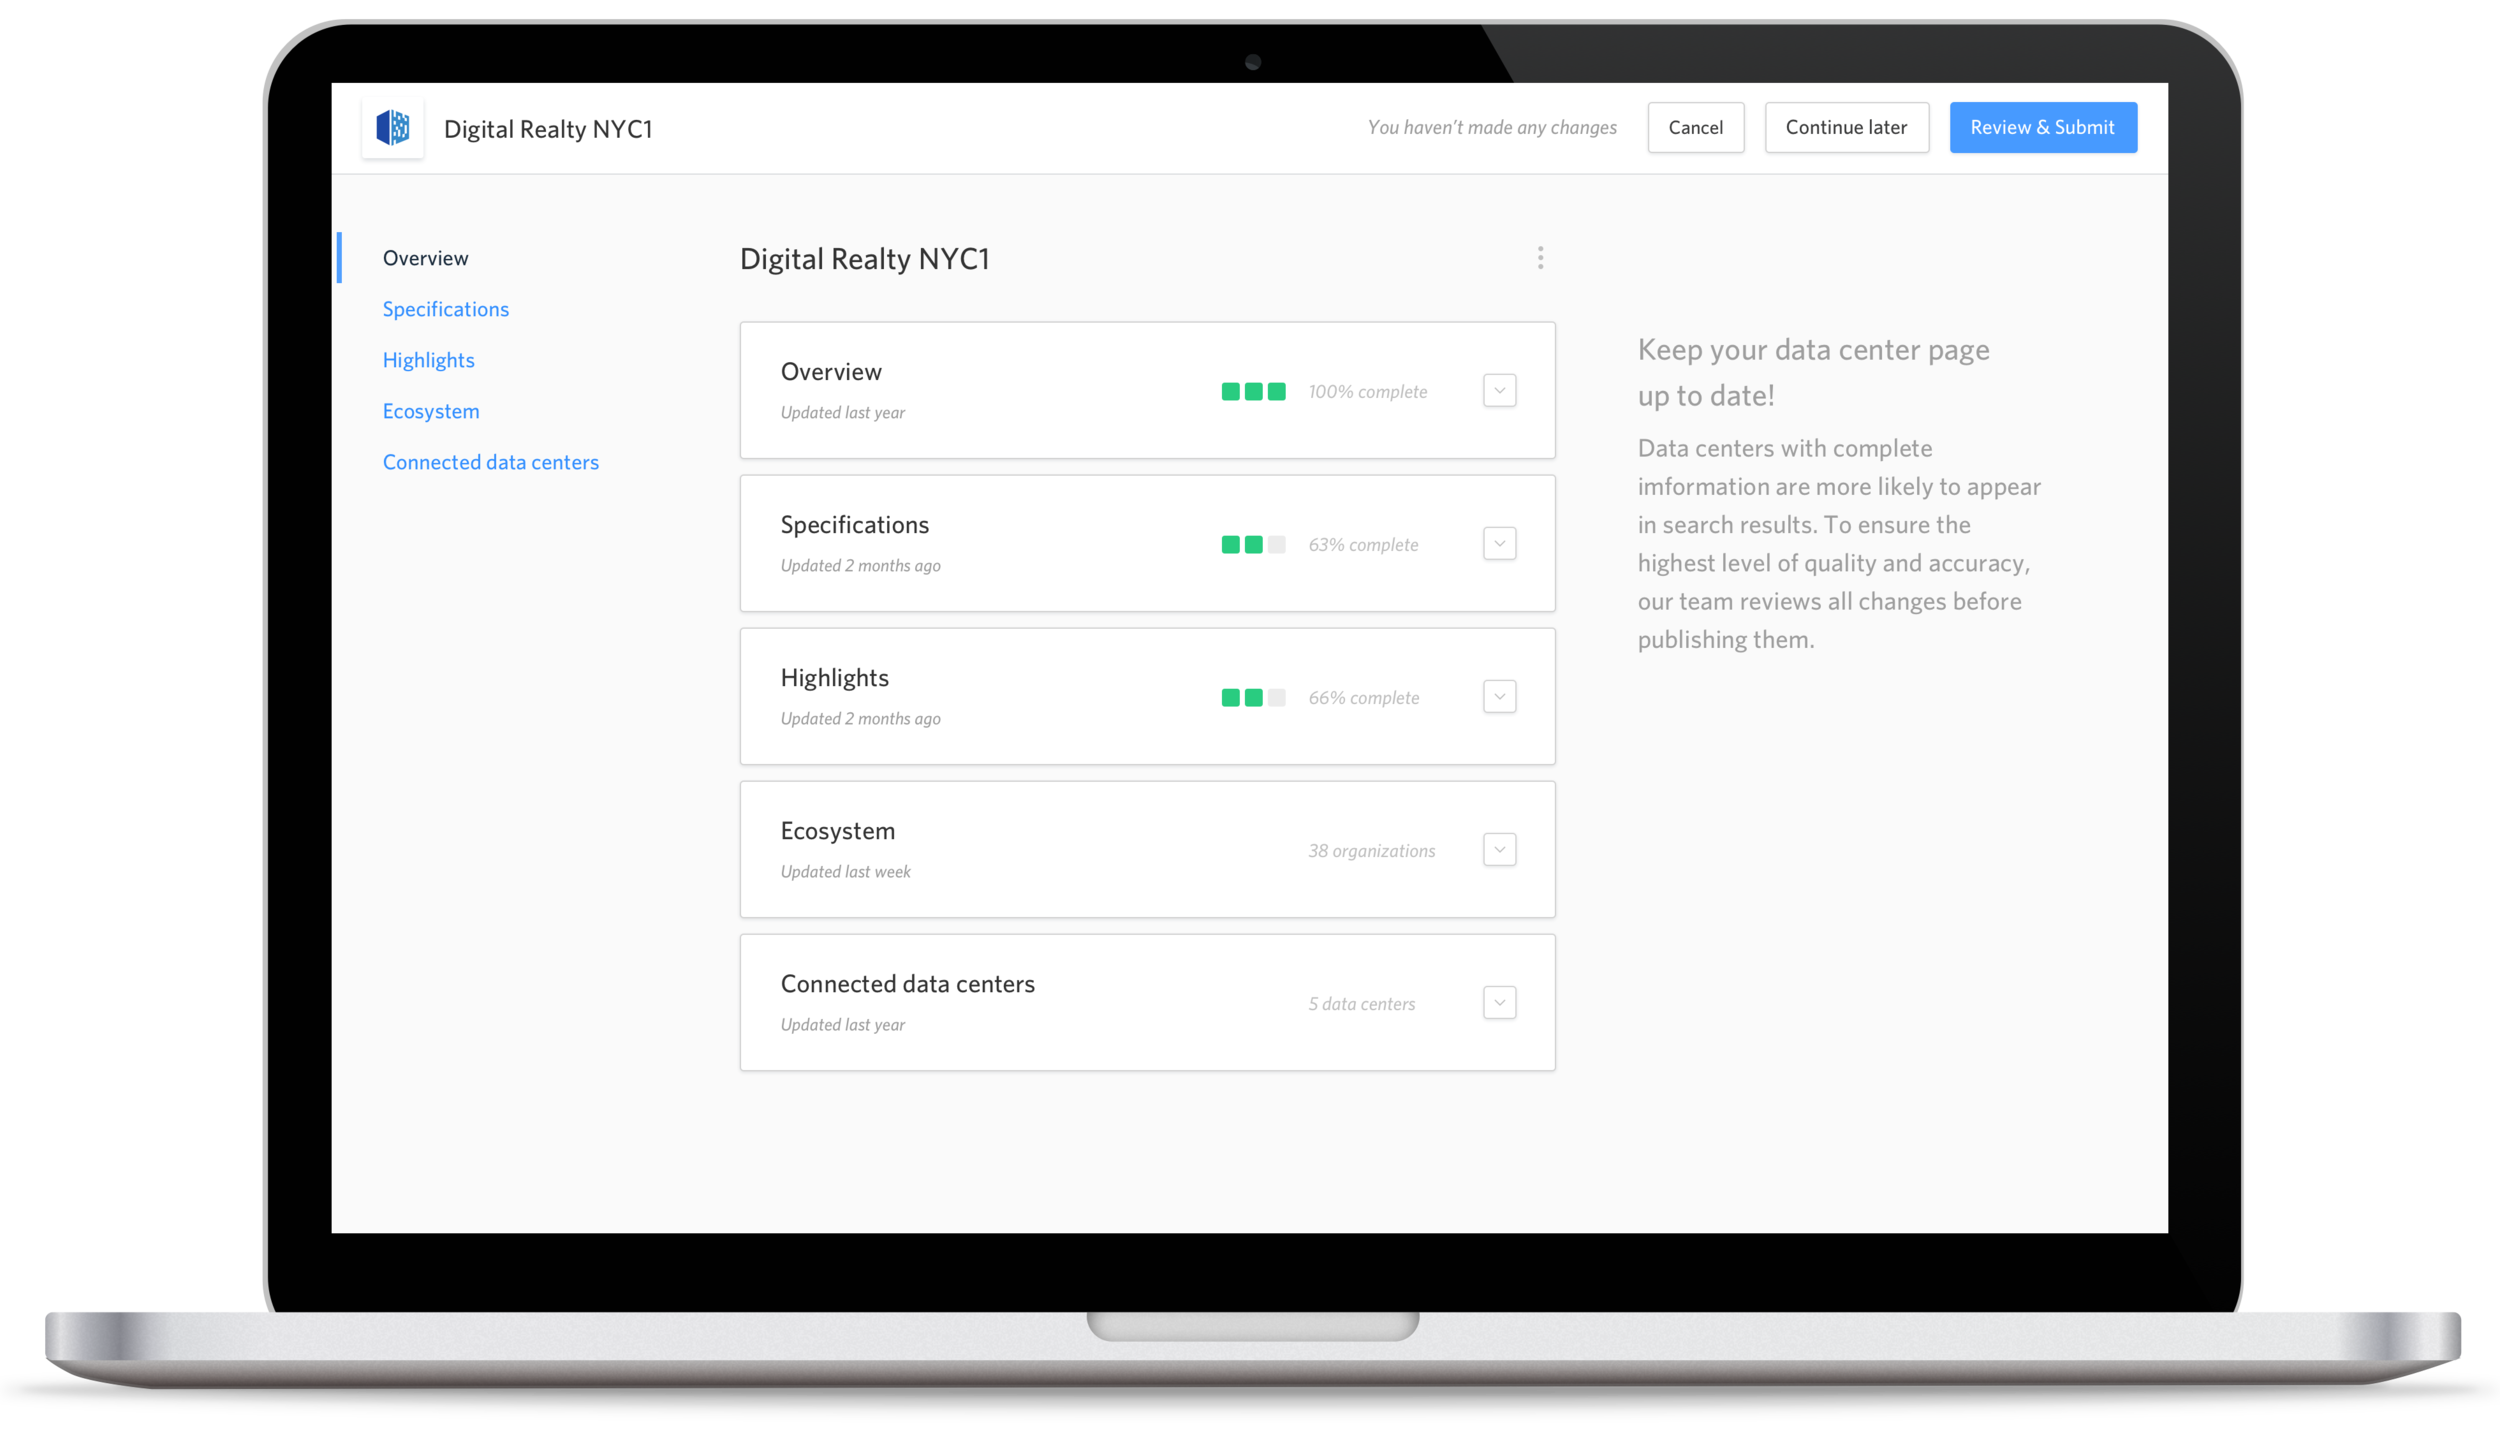
Inflect asset management tool
We also explored a product for helping service providers manage their service locations and public-facing data on the marketplace. This was only a prototype and hadn’t been built yet by the time I left Inflect.
Defining the need
Often, we knew more about the providers’ infrastructure than they knew about themselves
We learned from our discussions with service providers that they often don’t have a complete picture of themselves. Their teams are operating off of different data fragments and there isn’t a single source of truth between the operations teams, the marketing teams, and the sales teams, or across geographies. Years of mergers and acquisitions make the task even more challenging.
Inflect’s asset management tools were well-positioned to bring the network engineers, marketing departments, and sales teams together into a unified platform where they could be certain they were operating off of the latest information.
How can Inflect give service provider teams control over their data?
The current data indexing process was often time-consuming and manual, and handled by an internal data team within Inflect. We wanted to shift that effort onto the providers themselves, and providers were willing to pay to have more control over their public presence in the other Inflect tools.
Three approaches for editing data
We intended to build all three approaches, but we decided to develop the wizard flow first since it was the most universally applicable to all user types and use cases. We decided to build features that would be useful to more users first.
In-line on individual data center pages
Providers visit pages for data centers they own and edit information directly on the page, similar to editing a LinkedIn profile.
Works great for editing data centers that already exist on Inflect, but doesn’t make sense for newly added data centers.

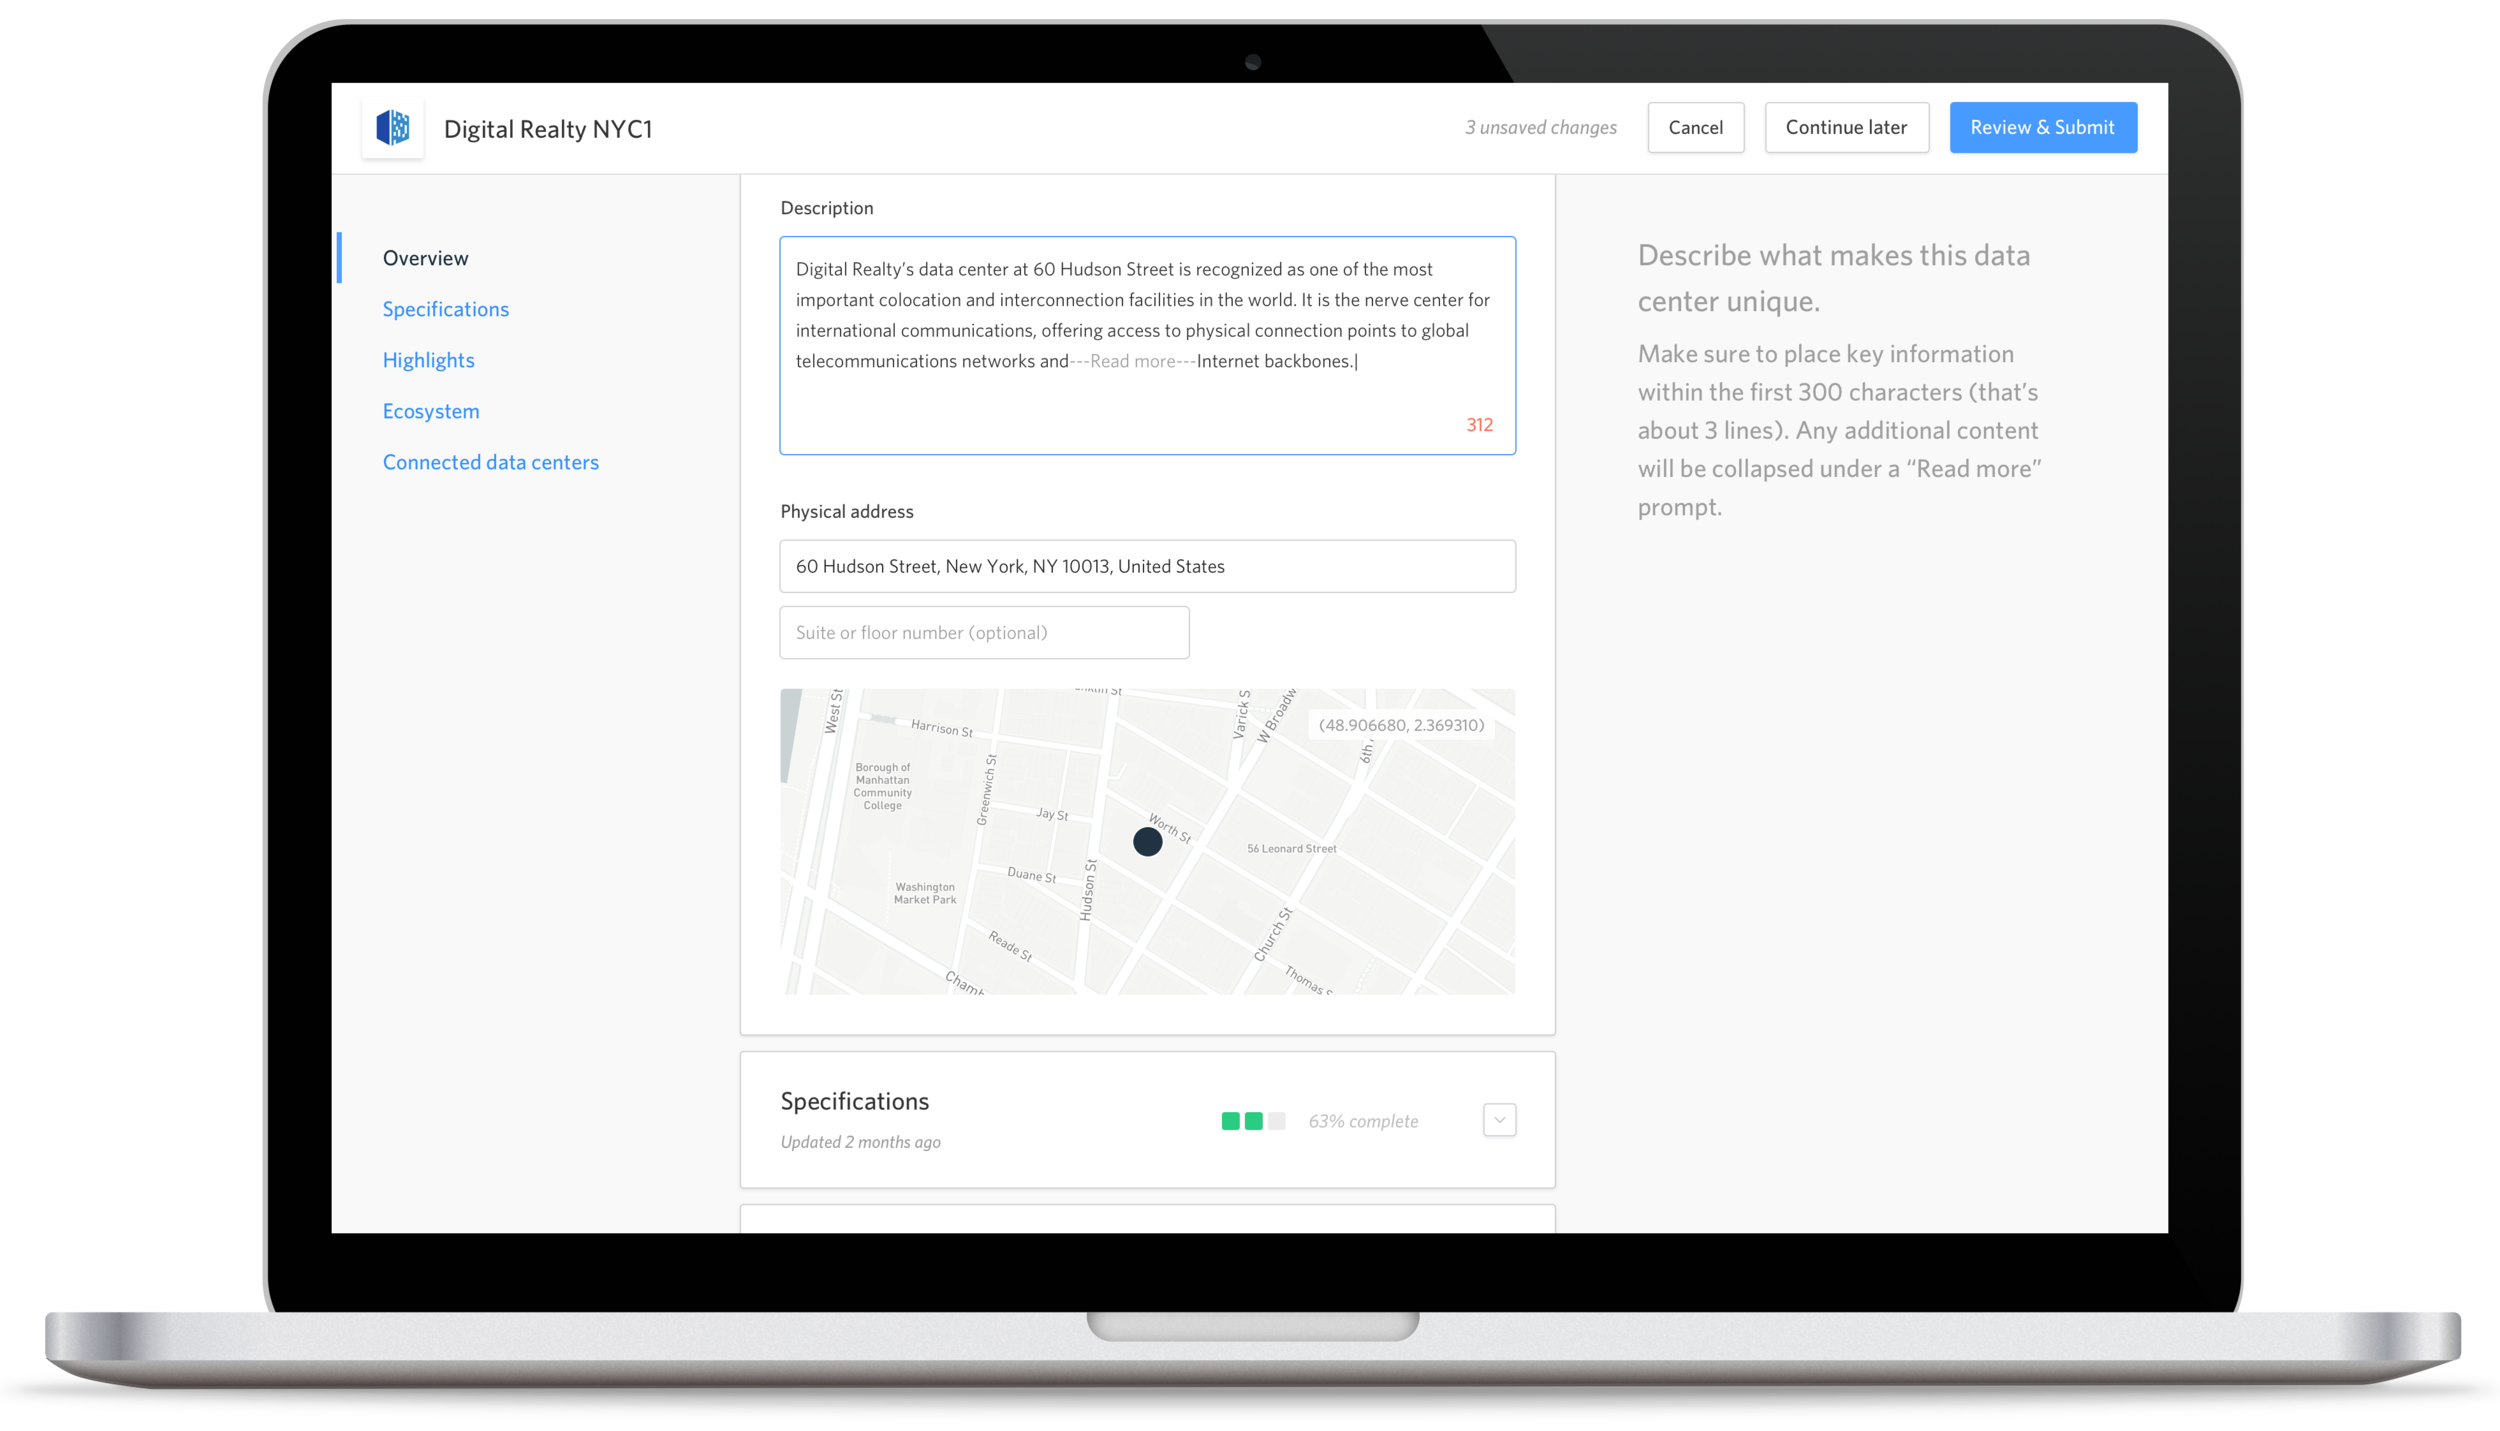
Wizard flow for each data center
Providers enter into a full screen asset adding experience and are walked through the details for each data center.
Works great for both new and existing data centers, but becomes tedious if adding or editing more than one data center at a time.

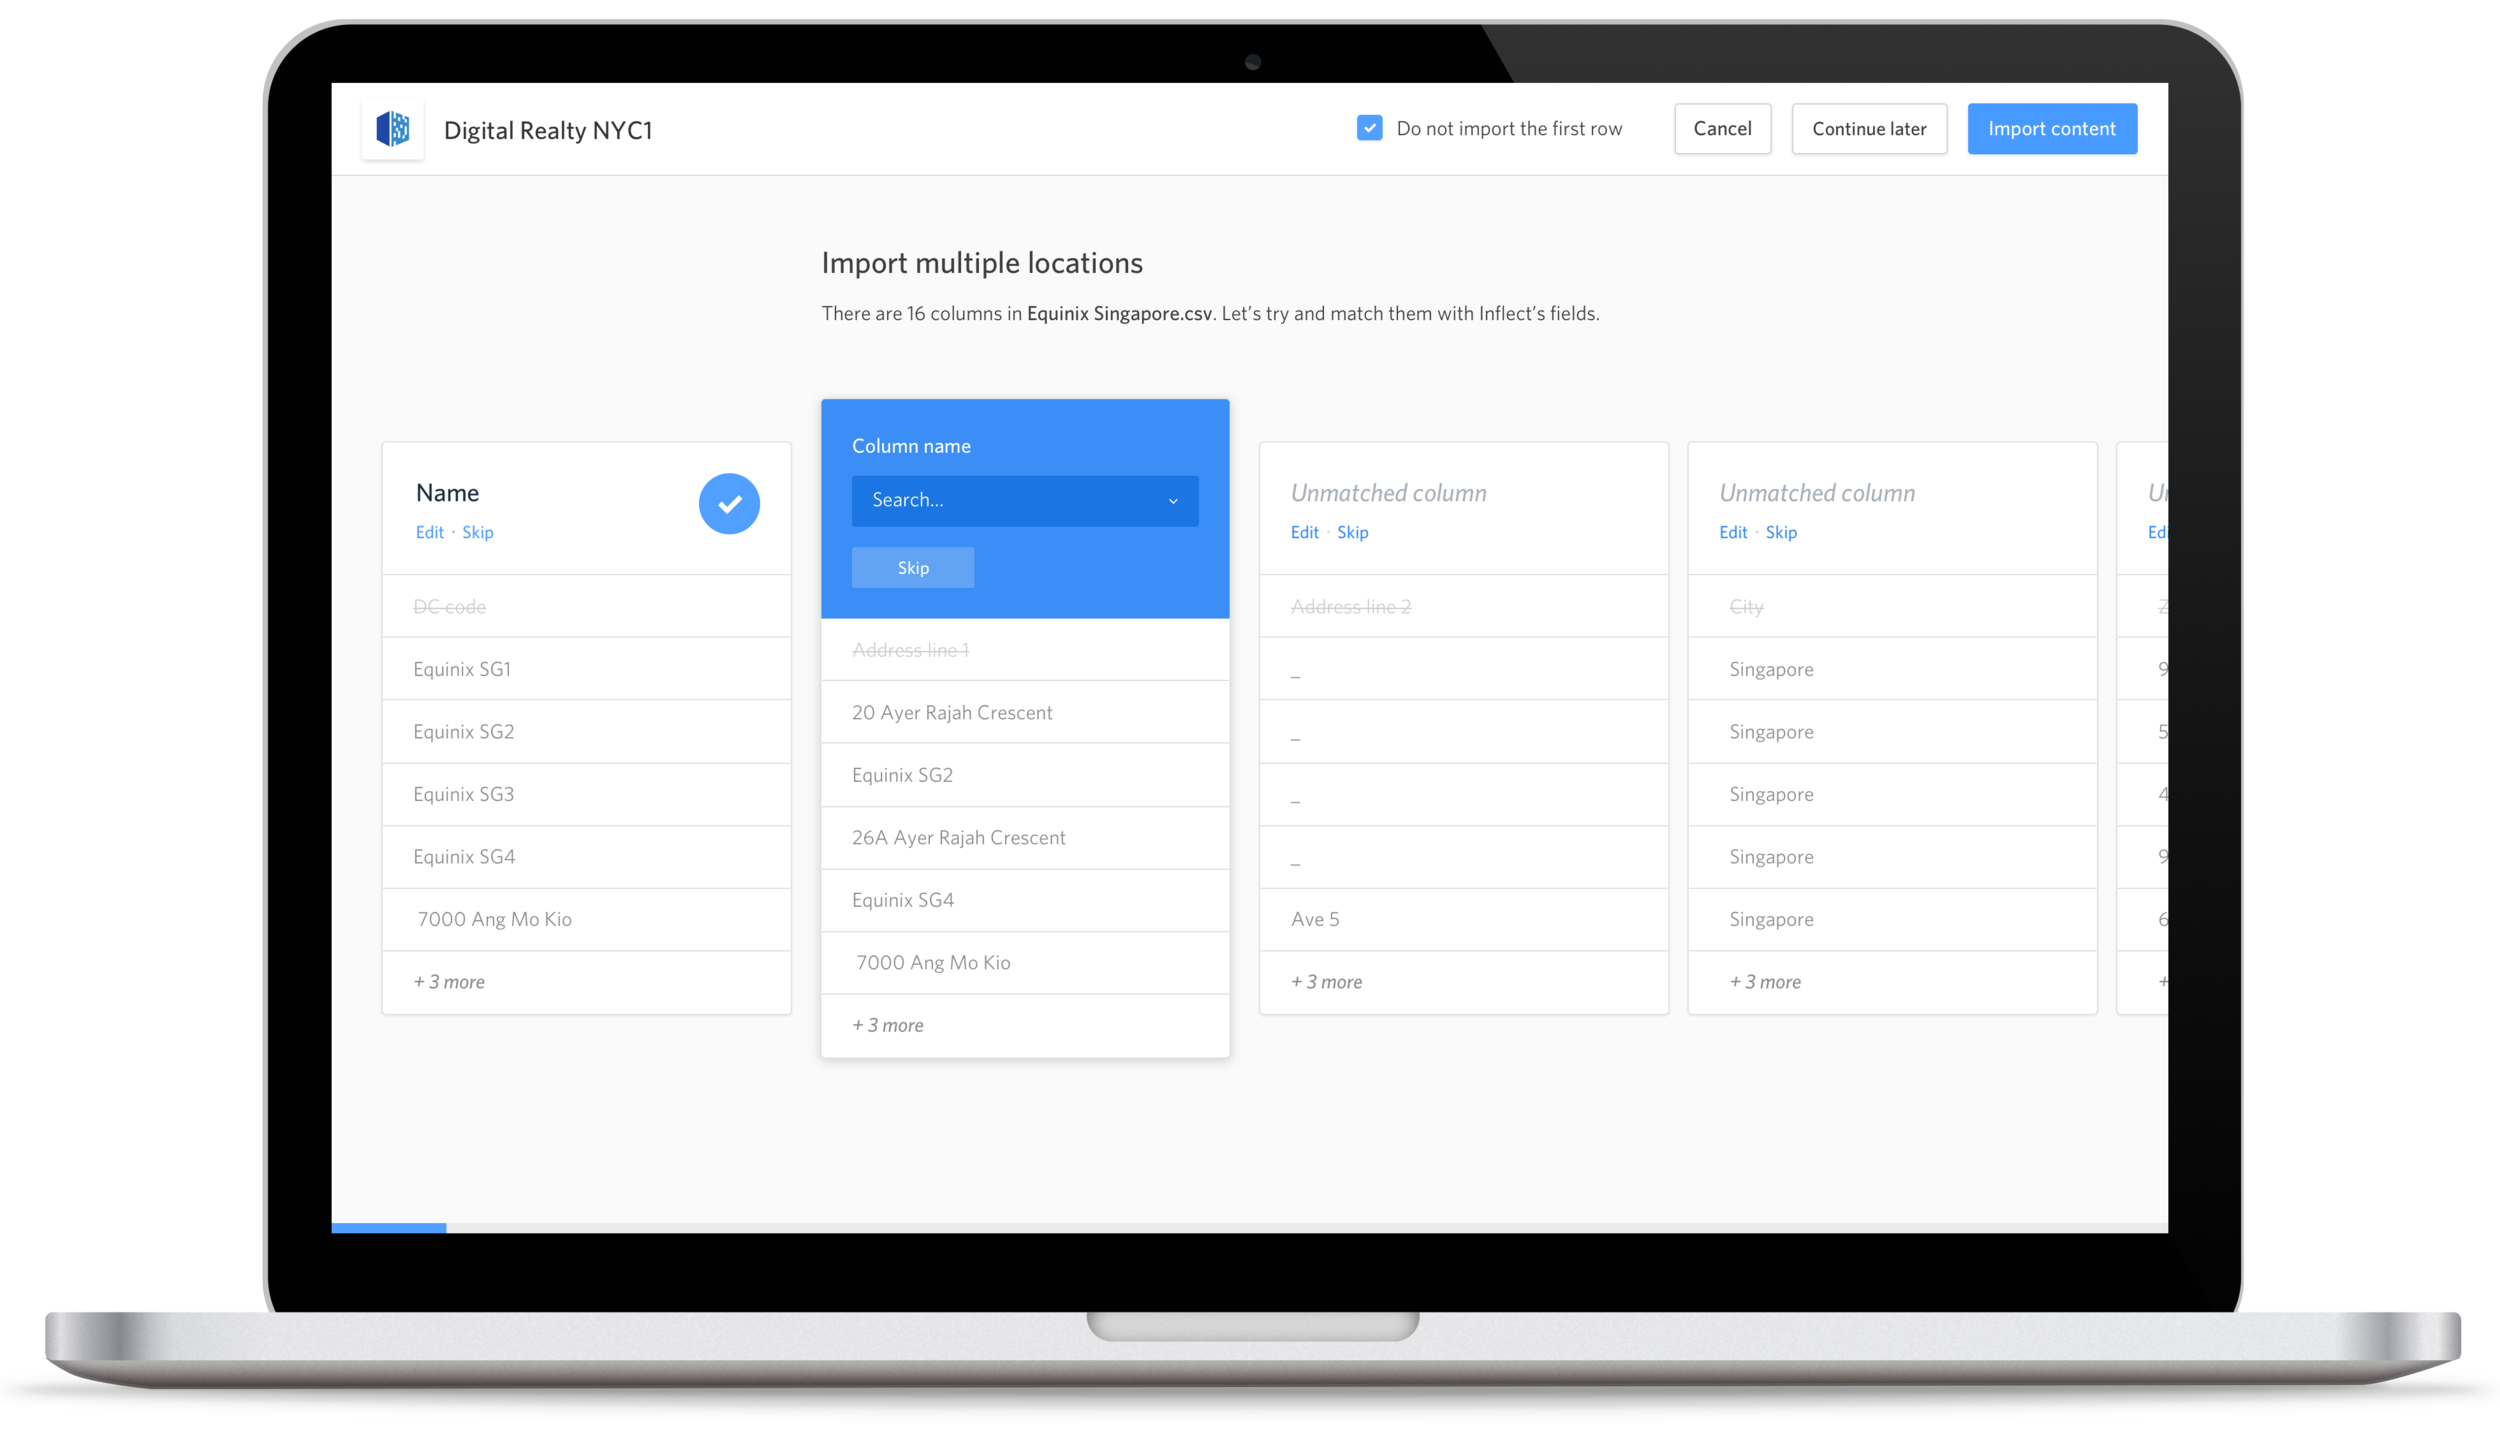
Bulk spreadsheet upload
Providers upload a spreadsheet with each row a different data center and each column a different attribute, and then are presented with an intuitive way to map each column header to a data field on Inflect.
Great for providers that have large numbers of data centers, however the majority of providers on Inflect only have 5 to 15 data centers.

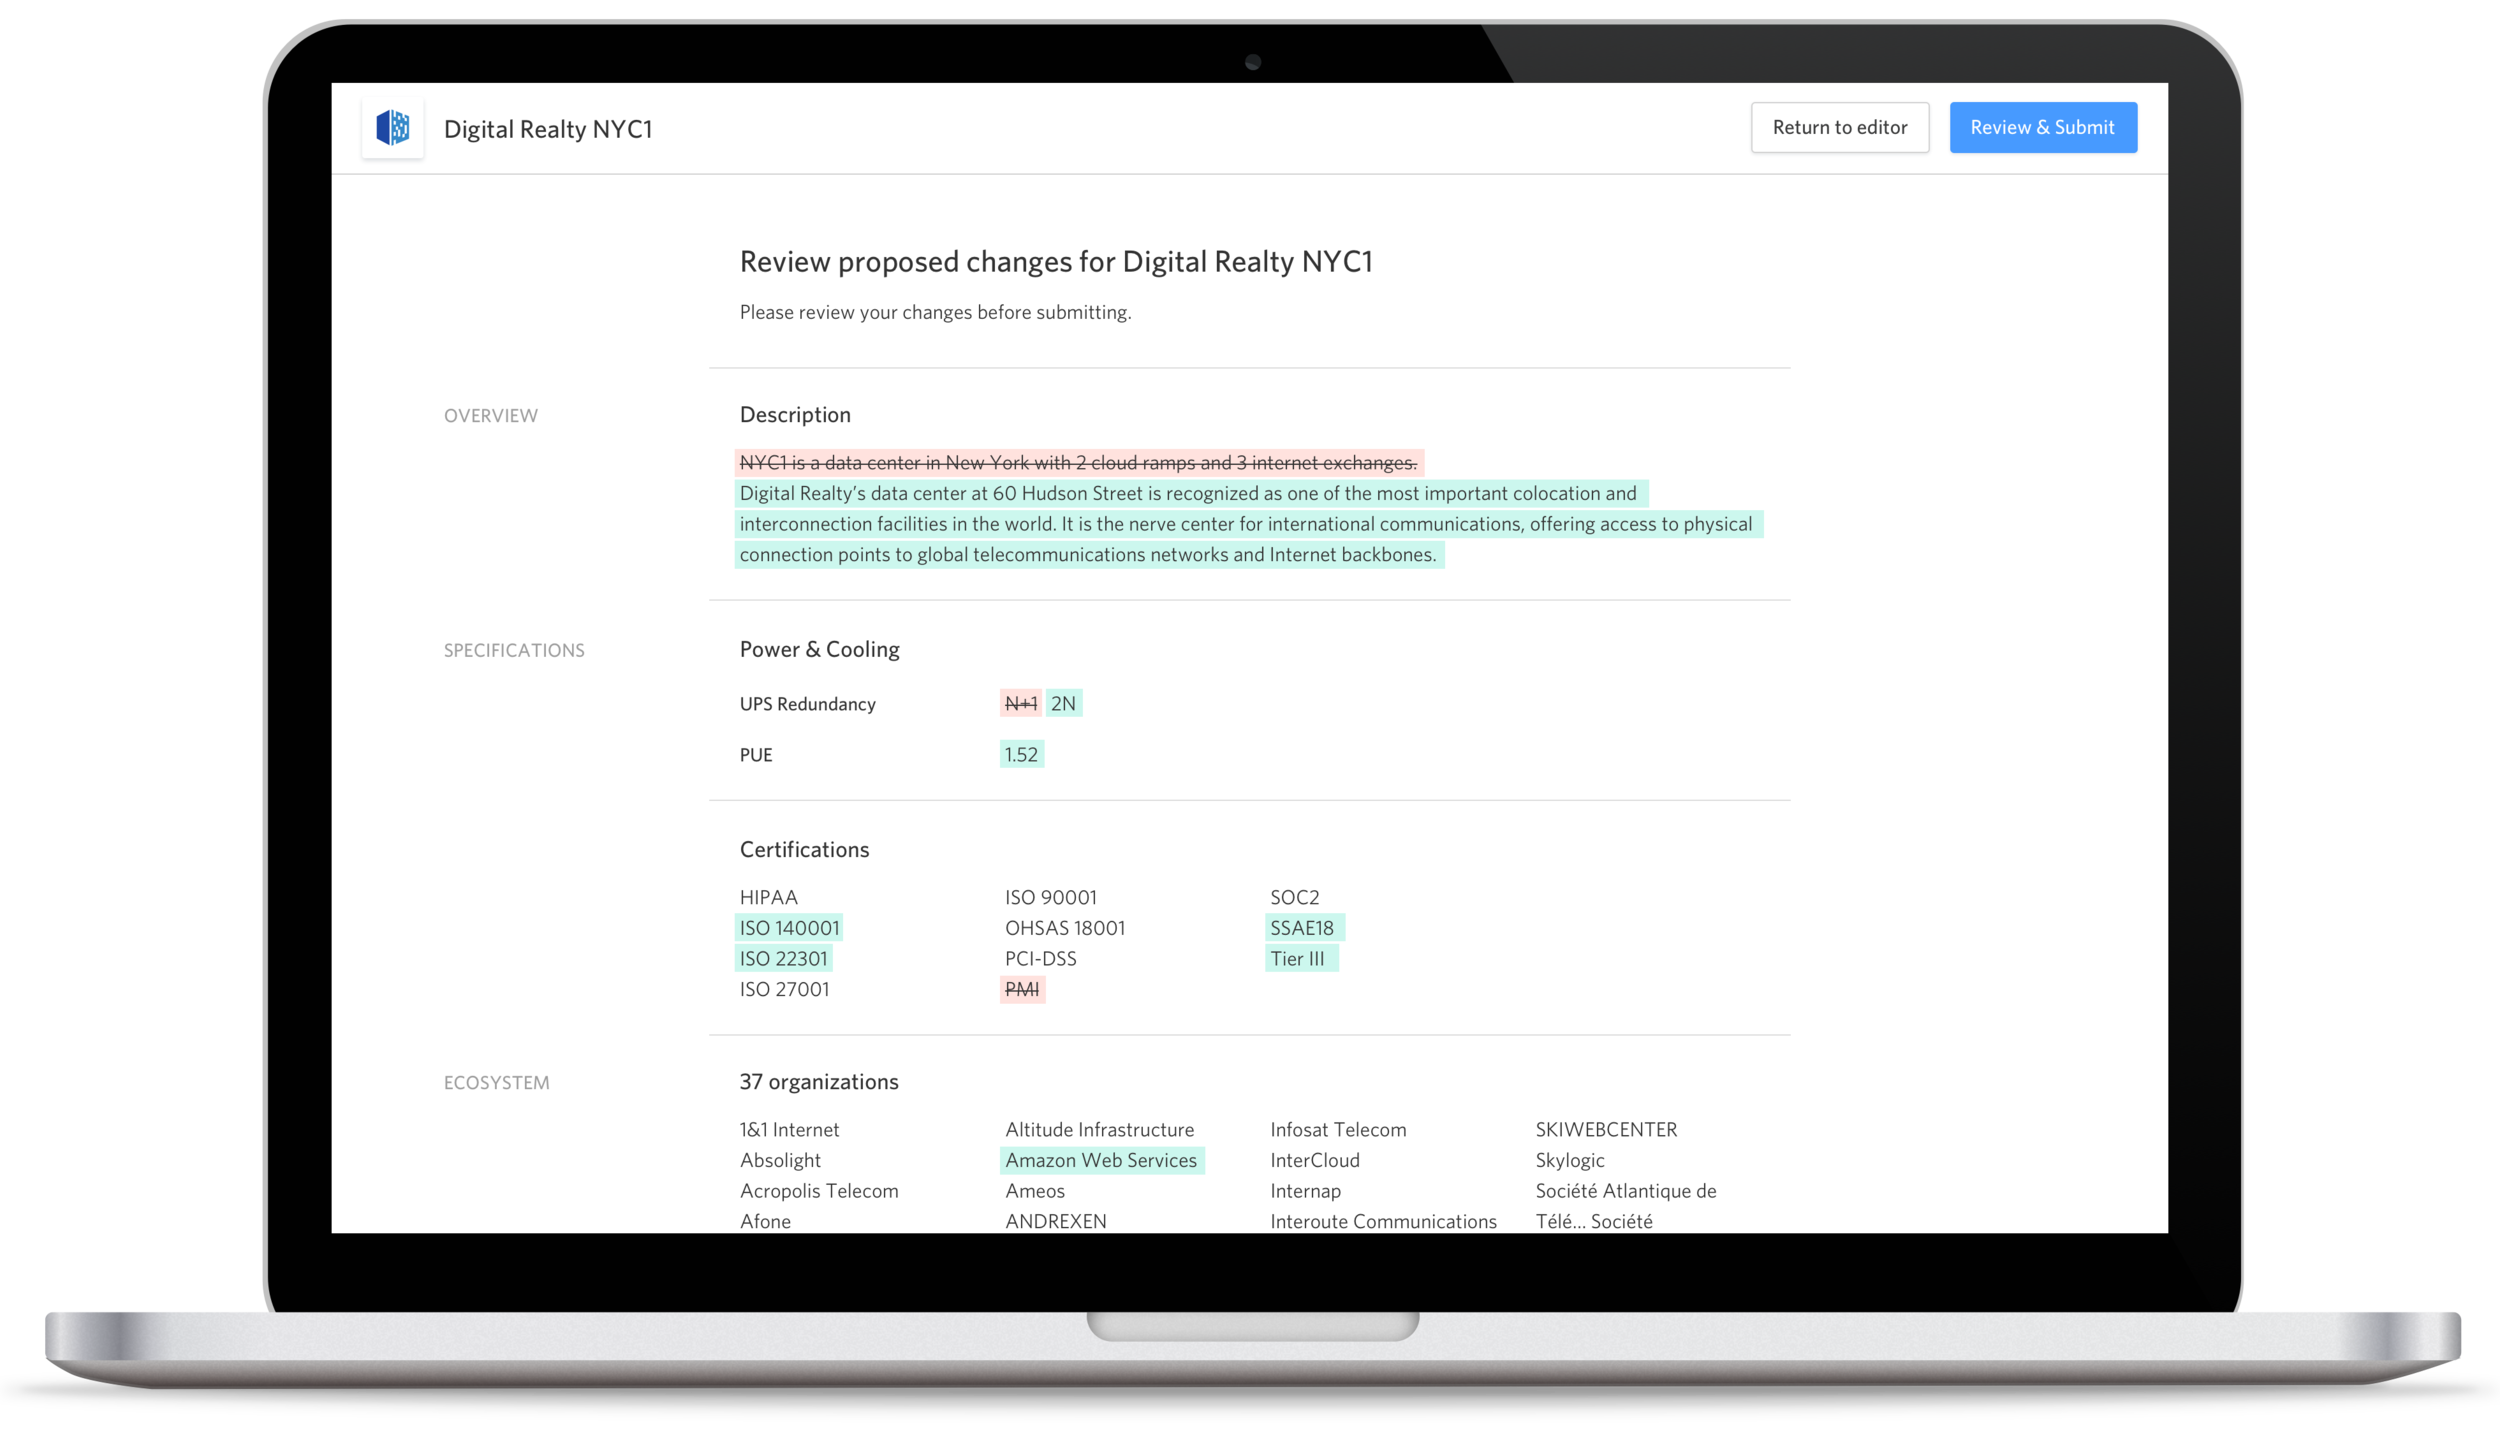
Tracking changes
Providers would be able to see and approve of the changes that their team members make to their assets. Network and data center service providers have many internal teams all managing different parts of their catalogue, and keeping everyone on the same page with the most up-to-date data is nearly impossible with current tools and processes.
Design system
I also initiated and directed the creation of our design system and component library.
Color system

Button styles

Icon system
The icons have softer, rounded corners to speak to the friendly, human brand we’ve built and lean away from the cold precision that’s typical of the rest of the industry.
Icons created by the amazing Cécile Parker
Logo Refinement
Soon after starting at Inflect, I spent a few hours refining our logo to be better suited for a digital product and at a wider range of sizes and contexts. I kept things similar overall given that the previous logo already had buy-in from leadership and we had a product to build, but I’d like to have had another chance to create a more unified mark and visual system post-product market fit.

Inflect Core Values Definition
While designing and building our product, I also lead a series of workshops to define who we are as a company, what we believe, and how we embody those beliefs through our behavior internally and externally.
The output of our sessions was the following positioning statement, a set of value propositions, a set of core values, and a handful of personality traits.
I used the Brand Deck as a conversation starter with the rest of the leadership team to help everyone articulate our company’s personality.
Positioning statement
“Inflect helps enterprises build the relationships that power the global data economy”
Value propositions
The value propositions then helped us focus our marketing messaging on our website and in our communications to users:
Core Values
The core values we defined helped guide our behavior as a company and appeared on our Careers page:
